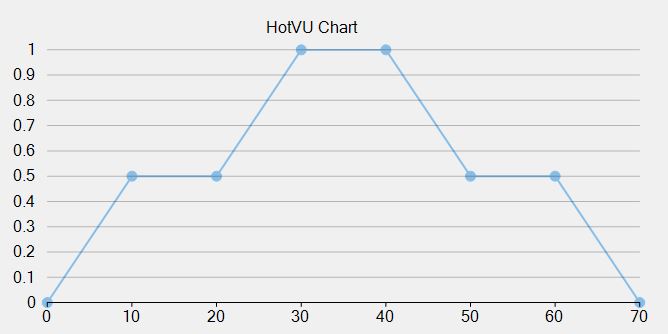
Is it possible to give user Interaction for Flex Chart?

Posted by: amit.jain3 on 14 April 2023, 12:22 am EST

  • Posted 14 April 2023, 12:22 am EST - Updated 14 April 2023, 12:27 am EST

    Hello,

    Is it possible to give user interaction for -

    1. Change Axis
    2. Let user change the color of the plotted line
    3. Can user add another Y Axis Say “Y2”

    When we open the FlexChart in Visual Studio We have some Menu options to change colors and legends, line patterns. So can we allow these Menus for user customization.

    Can you help mw to understand if these things are possible.

  • Posted 16 April 2023, 6:19 pm EST

    Hi Amit,

    Thanks for reaching out to us with your query.

    1. Could you please describe in detail, what you want to change in Axis?

    2. You can change the color of the plotted line by setting Style.StrokeColor of a particular series. Please refer the sample : FlexChartLineStyle.zip

    3. You can achieve this requirement. Please refer the product sample for the same.

      Go to: C:\Users\user.name\Documents\ComponentOne Samples\WinForms\v4.8\FlexChart\CS\FlexChartExplorer and run the sample. Navigate to Features->Chart Elements->Axes->Multiple Axis sample.

    4. For interaction and customization of FlexChart, you can add Ribbon or toolbar for flexchart. Please refer the product sample for the same: Go to-> C:\Users\user.name\Documents\ComponentOne Samples\WinForms\v4.8\FlexChart\CS\FlexChartExplorer and run the sample. Navigate to Features->Interaction->FlexChart Toolbar or FlexChartRibbon.

    Best Regards,

    Nitin

  • Posted 16 April 2023, 8:11 pm EST

    Hello Nitin,

    Thank you for the response.

    1. What I meant is can user interchange X and Y axis?
    2. For coloring I know how I can do it but can we allow user to change according to them.
    3. In Ribbon we have to create custom buttons, but these menus are already there so I was thinking if we can use the same feature rather than creating a custom RIbbon and allow user changes.
  • Posted 17 April 2023, 8:20 pm EST

    Hi Amit,

    Thanks for reaching out to us again.

    1. You can interchange values of Binding and BindingX to interchange both Axes.

      Please refer the attached sample: FlexChartAxisInterchange.zip
    2. Style can be changed programmatically. You need to create a specific control for the user. So, that user can change the color. Just like a sample provided earlier. There’s no direct way to change color at UI level.
    3. We are sorry but this is also not possible to achieve this requirement. User can’t customize the ribbon. Ribbon should be pre-defined programatically.

    Regards,

    Nitin

  • Posted 17 April 2023, 10:37 pm EST

    Hi Nitin,

    Thank you for the response.

    I got it we can give user interaction for color changing and other in the custom ribbon.

    For interchanging the axis the example you shared you are using 2 flex chart and changing bindings in the code to reflect.

    but I am looking if it can be done on User Input from UI, Like you shared a example to change the color in that user can select the color from the dropdown and it will reflect the chart

  • Posted 18 April 2023, 5:05 pm EST

    Hi Amit,

    You can achieve this requirement to interchange BindingX and Binding through UI. For example, you can implement a ComboBox to change the Plot-Axis and interchange Axes based on the selected item of ComboBox.

                comboBox1.SelectedValueChanged += (s, e) =>
                {
                    if(comboBox1.SelectedItem == "X-Y")
                    {
                        flexChart1.BindingX = "X";
                        series.Binding = "Y";
                    }
                    if (comboBox1.SelectedItem == "Y-X")
                    {
                        flexChart1.BindingX = "Y";
                        series.Binding = "X";
                    }
                };

    Please refer the attached sample for the same: FlexChartAxisInterchange_Mod.zip

    Best Regards,

    Nitin

  • Posted 19 April 2023, 4:15 am EST

    Hi Nitin,

    Thank you so much for the response. I’ll get back to you if I need any help to understand about Component One Chart

  • Posted 20 April 2023, 5:31 pm EST - Updated 20 April 2023, 5:37 pm EST

    Hi Nitin,

    I have 2 questions w.r.t flex chart

    1. Here If we see X Axis the points are 0,10,20,30,40 the difference is 10. If I want to keep that as 5 can I do it ? and can it be done for both X and Y axis?

    2. If I have 2 different series series 0 and series 1 how to select the line so that user can change the color. I already know how we can change the color but how to select the lines?

  • Posted 20 April 2023, 9:15 pm EST

    Hi Amit,

    Thanks for reaching out to us with your query again.

    1. To achieve this requirement you need to set MajorUnit property for a particular Axis(AxisX or AxisY).
        flexChart1.AxisX.MajorUnit = 5;
    1. You can refer here for FlexChart Selection: https://www.grapecity.com/componentone/docs/win/online-flexchart/selection.html

      You can specify a style for a Selected Series. So, that we can identify which Series is selected.

      Then, you can change the color of the Selected Series through ComboBox.

    We have created a sample for you to achieve this requirement. We have set Gray stroke color to identify which series is selected i.e., once you select a series, it’s Stroke will be shown with gray color. Series color changing does not come into the picture yet. This style is to identify the selected series on UI level. Now you can change the color of the Selected series from combo-box.

    Please refer the sample: FlexChartLineStyle_Mod.zip

    Best Regards,

    Nitin

  • Posted 25 April 2023, 4:30 pm EST

    Hi Nitin,

    Thank you for the response with the example you shared I am able to plot 2 series and I understood to add multiple series.

    I have a question previously I have got a solution to ADD/DELETE points in Flex Chart. That was working because I had only 1 series.

    Now if I have 2 series and now if I want to ADD/DELETE points how it can be done?

  • Posted 26 April 2023, 4:41 pm EST

    Hi Amit,

    You can easily Add/Delete a point from FlexChart by adding/removing DataItem of the bounded collection of FlexChart.

    As per the below example, you can add a new point to the last and delete the last point from FlexChart:

            private void Add_Point(object sender, EventArgs e)
            {
                var random = new Random();
                DataPoints.Add(new DataPoint() { X=(DataPoints.Count==0)?0:(DataPoints.Last().X + 10), Y1= random.NextDouble(), Y2= random.NextDouble() });
            }
    
            private void Delete_Point(object sender, EventArgs e)
            {
                if(DataPoints.Count>0)
                    DataPoints.RemoveAt(DataPoints.Count - 1);
            }

    Please refer the attached sample for the same: FlexChartAddRemovePoint.zip

    If you have another requirement, feel free to share your requirement. We will try to achieve and give you the best solution to achieve your requirement.

    Best Regards,

    Nitin

  • Posted 26 April 2023, 9:11 pm EST

    Hello Nitin,

    The Example you shared in that you are adding the point in both Series but If I want to insert in 1 series only that is not possible in flex chart?

    If it is not possible in Flex Chart Is it possible to do this in Legacy Chart?

  • Posted 26 April 2023, 9:11 pm EST

    Hello Nitin,

    The Example you shared in that you are adding the point in both Series but If I want to insert in 1 series only that is not possible in flex chart?

    If it is not possible in Flex Chart Is it possible to do this in Legacy Chart?

  • Posted 27 April 2023, 5:06 pm EST

    Hi Amit,

    Of course, you can add/remove a point for a particular Series. In order to achieve this requirement you need to specify a particular DataSource for each Series and can perform actions for particular Series by modifying the respective DataSources.

    Set specific DataSource for Series

    //Series 1
    var series1 = new Series();
    series1.Binding = "Y";
    series1.DataSource = DataPoints1;
    flexChart1.Series.Add(series1);
    
    //Series 2
    var series2 = new Series();
    series2.Binding = "Y";
    series2.DataSource = DataPoints2;
    flexChart1.Series.Add(series2);

    Modify DataSources:

    private void Add_Point_Series1(object sender, EventArgs e)
    {
        var random = new Random();
        DataPoints1.Add(new DataPoint() { X = (DataPoints1.Count == 0) ? 0 : (DataPoints1.Last().X + 10), Y = random.NextDouble() });
    }
    
    private void Delete_Point_Series1(object sender, EventArgs e)
    {
        if (DataPoints1.Count > 0)
            DataPoints1.Remove(DataPoints1.Last());
    }
    
    private void Add_Point_Series2(object sender, EventArgs e)
    {
        var random = new Random();
        DataPoints2.Add(new DataPoint() { X = (DataPoints2.Count == 0) ? 0 : (DataPoints2.Last().X + 10), Y = random.NextDouble() });
    }
    
    private void Delete_Point_Series2(object sender, EventArgs e)
    {
        if (DataPoints2.Count > 0)
            DataPoints2.Remove(DataPoints2.Last());
    }

    Please refer the attached modified sample: FlexChartAddRemovePoint_Mod.zip

    Best Regards,

    Nitin
Need extra support?

Upgrade your support plan and get personal unlimited phone support with our customer engagement team

Learn More

Forum Channels