Posted 28 May 2020, 2:37 am EST
Hi, am new to charts in general. I understood in a Flexreport i can make a FlexChart field and a legacy PieChart Field.
But how can i print a flexpie class chart?
I dont get it …
Thanx for any help
Forums Home / ComponentOne / WinForms Edition
Posted by: andreas.kren on 28 May 2020, 2:37 am EST

andreas.kren
Posted 28 May 2020, 2:37 am EST
Hi, am new to charts in general. I understood in a Flexreport i can make a FlexChart field and a legacy PieChart Field.
But how can i print a flexpie class chart?
I dont get it …
Thanx for any help

basant.khatiyan
![]()
Posted 28 May 2020, 9:04 pm EST
Hi,
FlexChart can be printed using a library named ‘C1.WPF.FlexChart.Printing’ as shown in the ‘FlexChartPrint’ product sample. The location for this sample would be ‘Documents\ComponentOne Samples\WinForms\v4.5.2\C1FlexChart\CS\FlexChartPrint’. However, I have made slight changes to make this library work for FlexPie as well. Please find the attachment for the updated library.
Regards,
Basant
andreas.kren
Posted 28 May 2020, 11:12 pm EST
thank you! the c1.win.chart namespace
.Drawchart has been released in which release? do you know? our latest used release is 2019.02
andreas.kren
Posted 28 May 2020, 11:15 pm EST
and I cant print it in a flexreport, right?
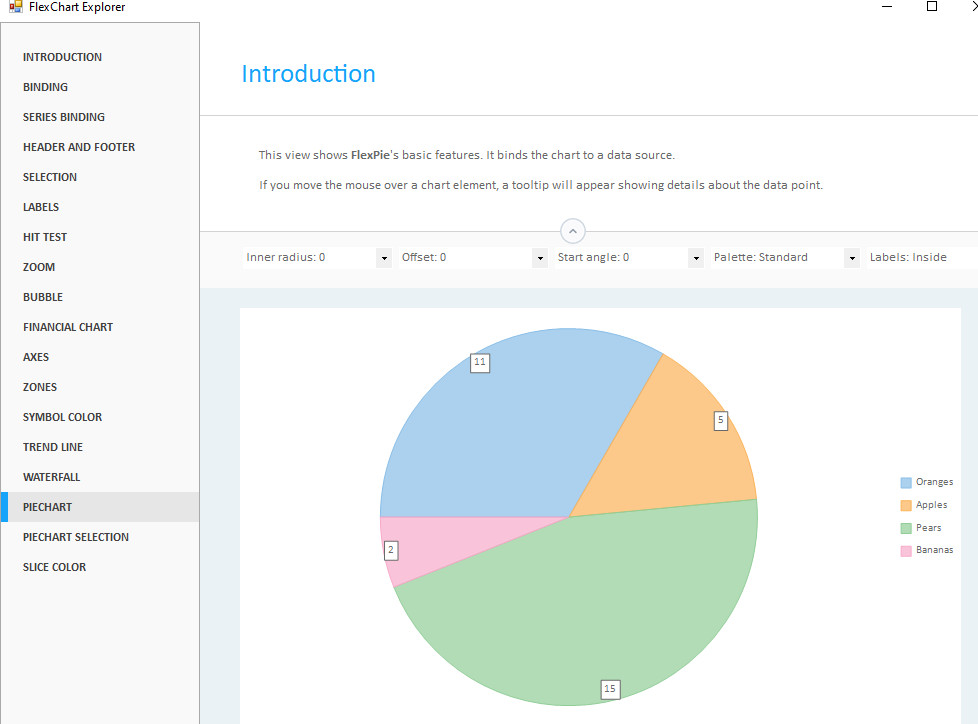
My prob is simple: i have to label the values within the pie chart parts and was not able to see how with the legacy piechart (for flexreport)
then i saw this in an flexpie example, this led me to asking the question here in the forum.
regards
basant.khatiyan
![]()
Posted 31 May 2020, 5:20 pm EST - Updated 3 October 2022, 2:51 pm EST
Hi,
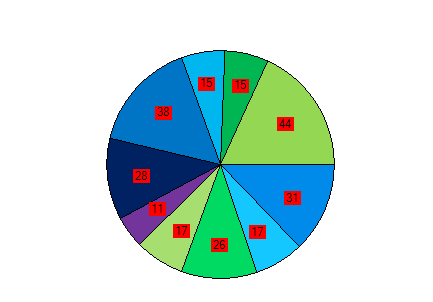
At the first place, I would like you to know that Chart (legacy) in FlexReport supports displaying DataLabel for series which can be used to meet your requirement. (Refer https://www.grapecity.com/componentone/docs/win/online-flexreport/C1.Win.FlexReport.4.5.2~C1.Win.FlexReport.Chart.ChartDataSeries~DataLabel.html)
For example:
            ChartField chart = new ChartField();
            chart.Height = 5000;
            chart.Width = 8000;
            var group = chart.ChartGroups2D.Group0;
            group.ChartType = C1.Win.FlexReport.Chart.Chart2DType.Pie;
            for(int i = 0; i < 10; i++)
            {
                var ser = group.ChartData.UnboundSeriesList.AddNewSeries();
                ser.DataLabel.Compass = C1.Win.FlexReport.Chart.ChartLabelCompass.Radial;
                ser.DataLabel.Visible = true;
                ser.DataLabel.Text = "{#YVAL}";
                ser.DataLabel.Offset = -400;
                ser.DataLabel.Style.BackColor = Color.Red;
                ser.Y = new double[] { rnd.Next(10, 50) };
            }
The above code will display the chart as follows:
The library I suggested earlier was for printing a FlexChart to a hardware printer by the help of PrintDialog. However, now looking at your requirement, it seems like you simply need the image of the FlexPie and use that image inside the FlexReport. So, if you still need to use FlexPie, then for that you can simply use the FlexPie.SaveImage() method for saving the FlexPie as image image and then use that image in FlexReport as needed. (Refer https://www.grapecity.com/componentone/docs/win/online-flexchart/export.html)
Regards,
Basant