Hi,
Thank you for sharing the sample.
> ChartType “Bar” somehow interprets a int as a DateTime
As I can observe, it is not specific to Bar chart. You have specified FlexChart’s BindingX to ‘DateTime’ and Count Series’s Binding property to ‘Count’. Since, the Axis you are displaying on Top belongs to Count series (whose X axis is bound to DateTime) and hence the behavior.
If the BindingX/Binding properties of Series are not set then the Series uses FlexChart’s BindingX/Binding properties.
JFYI, when Bar chart is used it then all the series Binding/BindingX properties works in reverse order.
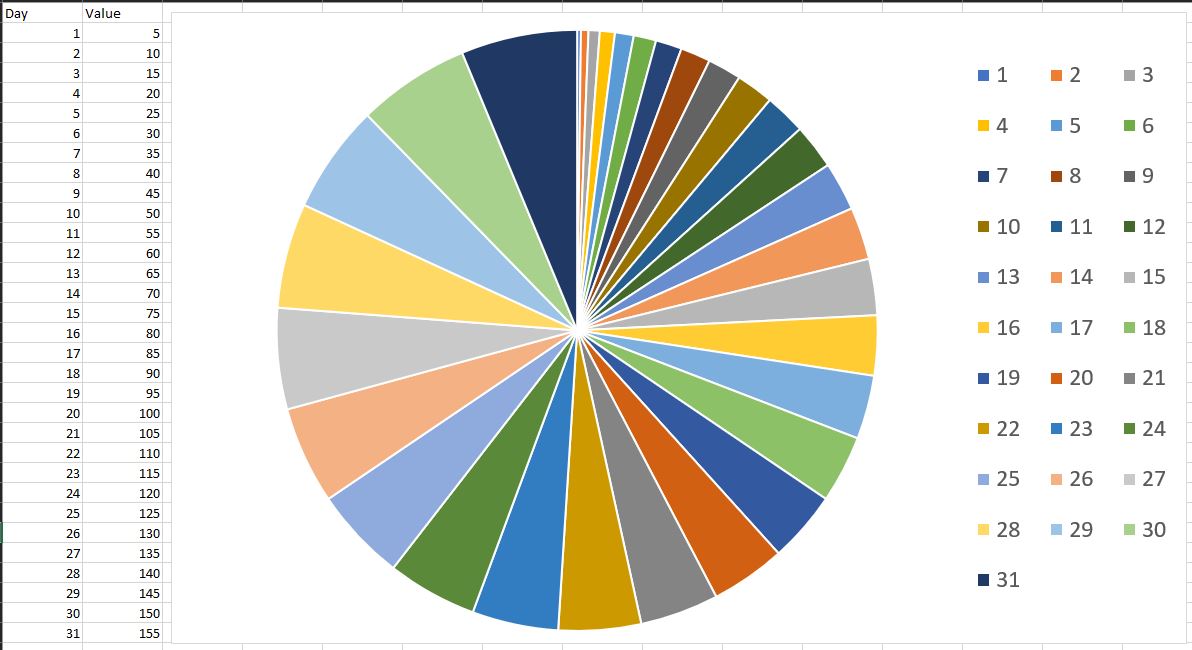
> FlexPie doesn’t seem to give a way to format the Legend
We are sorry but FlexPie currently doesn’t support legend formatting. However, this seems like a valid requirement so I have raised an enhancement request for the same. [Internal tracking ID - C1CHART-1811]
Just in case required you can use the following workaround to set the Legend Format.
private void SetLegendFormat()
{
       var pieCanvas = Template.FindName("canvas", this) as Canvas;
       var legendCanvas = pieCanvas.Children.OfType<Canvas>().First();

       foreach (var textBlock in legendCanvas.Children.OfType<TextBlock>())
       {
             if (textBlock.Text.IsDateTime(out DateTime date))
                 textBlock.Text = date.ToString(LegendFormat);
             else
                 textBlock.Text = string.Format("{0:"+LegendFormat+"}", textBlock.Text);
       }
}
Please refer to the same from the attached modified sample. (see FlexChart_Mod.zip)
> Color Palette is repetive with the excact color codes instead of relying on different shades
This is the default behavior of FlexPie. However, you can manually set the FlexPie palette using its CustomPalette property as follows:
flexPiePalette.Palette = C1.Chart.Palette.Custom;
flexPiePalette.CustomPalette = new CustomPalette(100);
Please refer to the attached sample for full implementation.
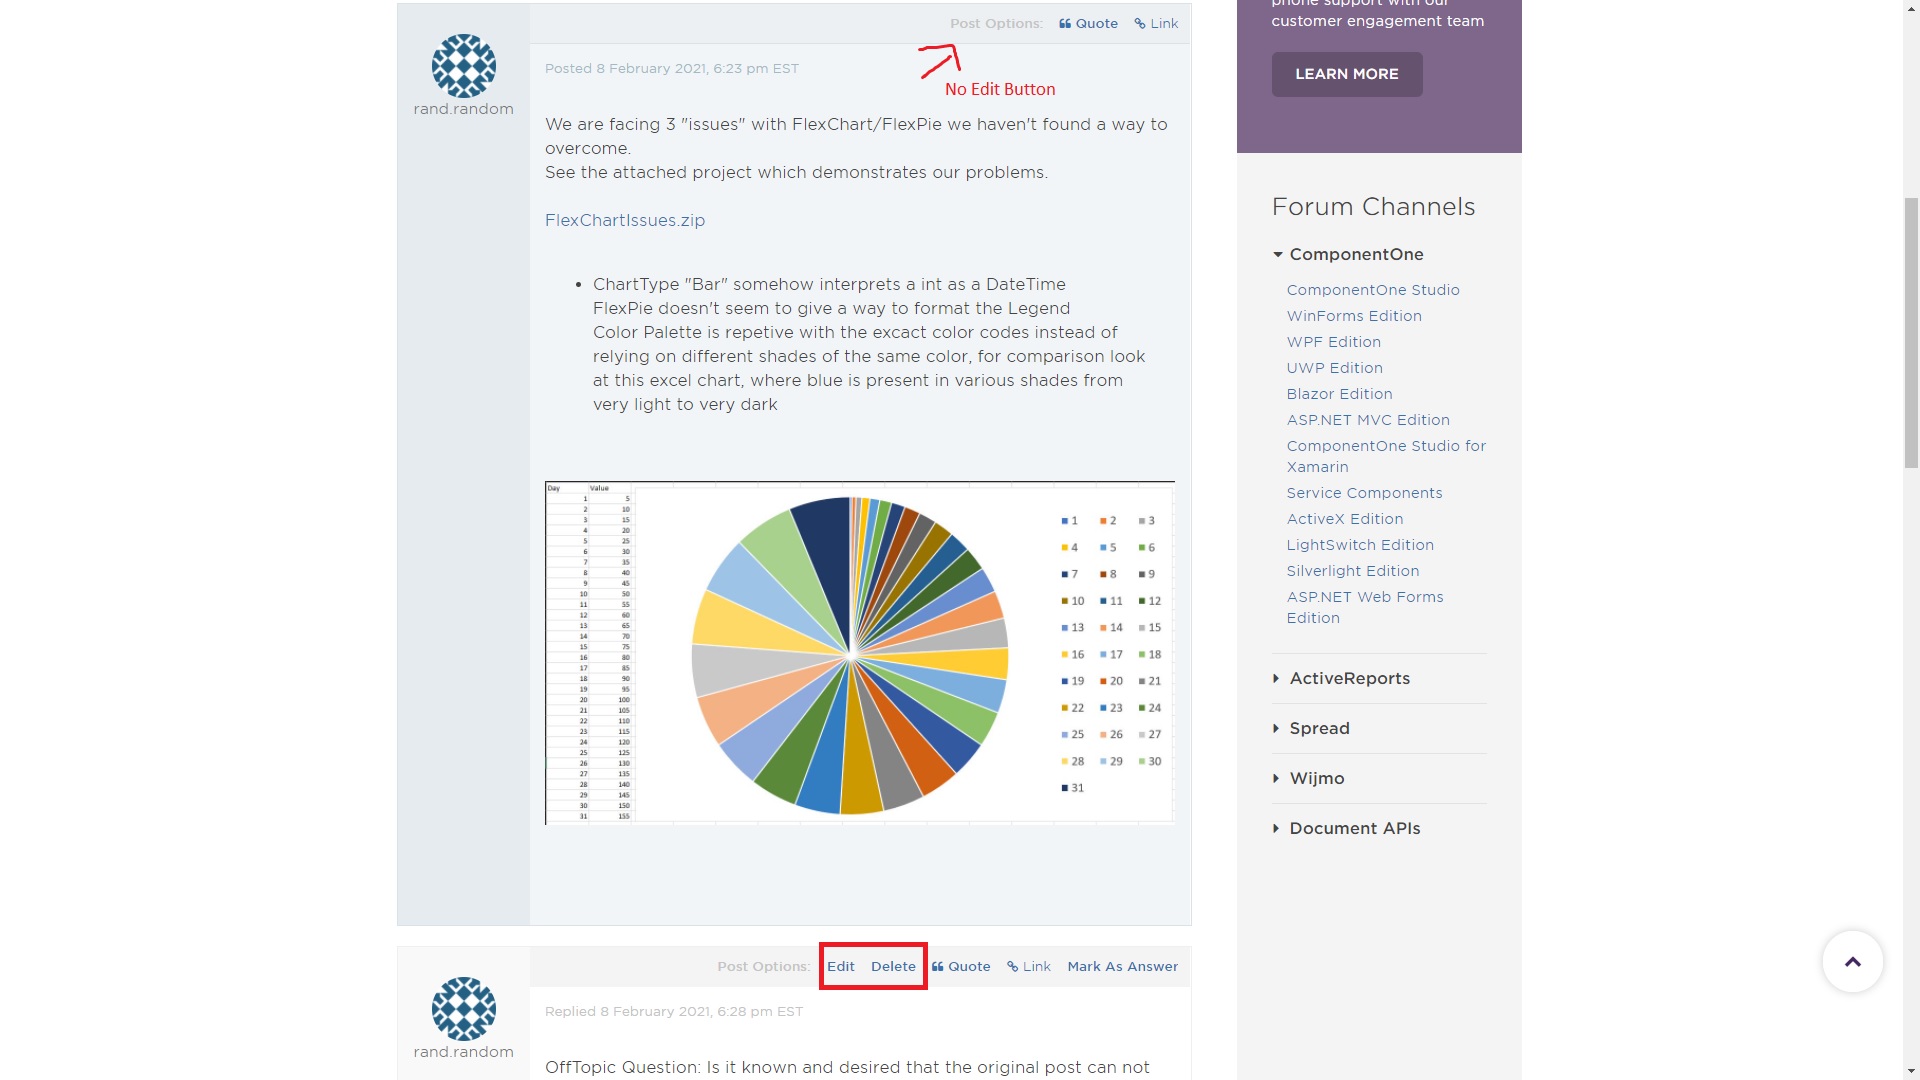
> OffTopic Question: Is it known and desired that the original post can not be edited?
We are discussing it internally and will get back to you when there is any update.
Best Regards,
Kartik
FlexChart_Mod.zip