Unable to set min, max of YAxis in FlexChart

Posted by: glen.herman on 22 July 2019, 12:56 am EST

    • Post Options:
    • Link

    Posted 22 July 2019, 12:56 am EST - Updated 4 October 2022, 12:05 am EST

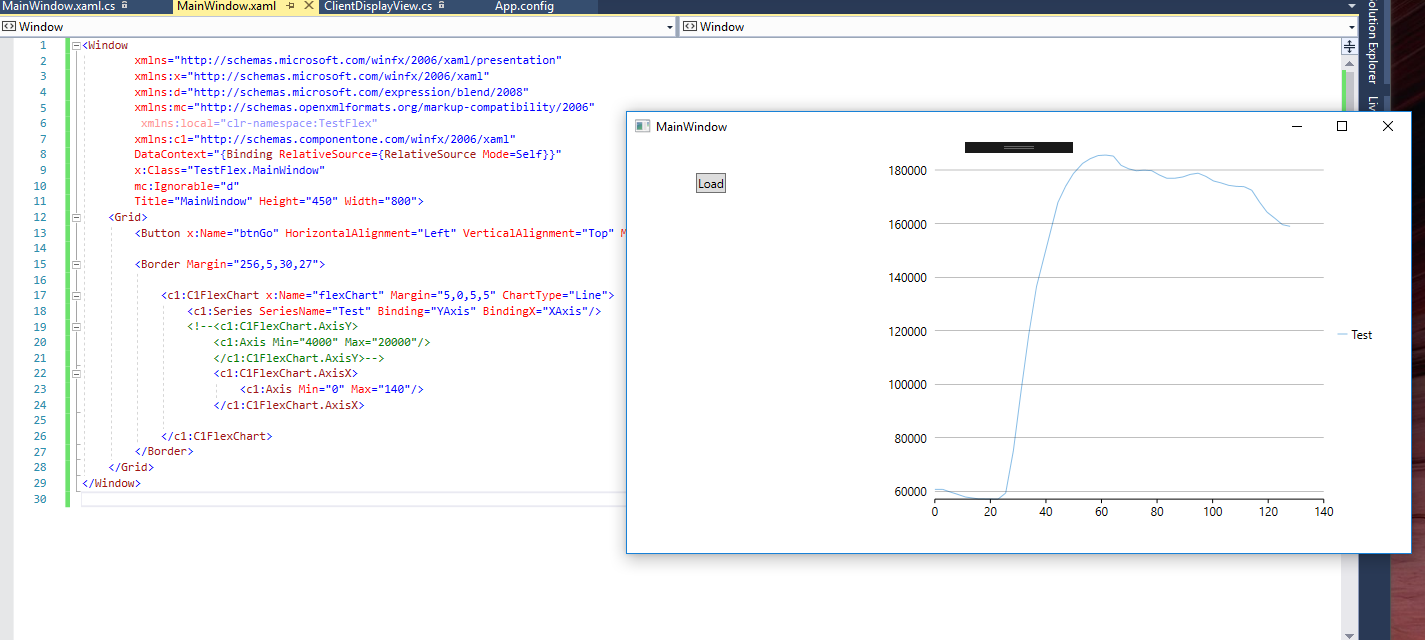
    I have a basic flexchart with data loading onto the chart fine. If I specify the x axis min, max:

    c1:C1FlexChart.AxisX

    <c1:Axis Min=“0” Max=“140”/>

    </c1:C1FlexChart.AxisX>

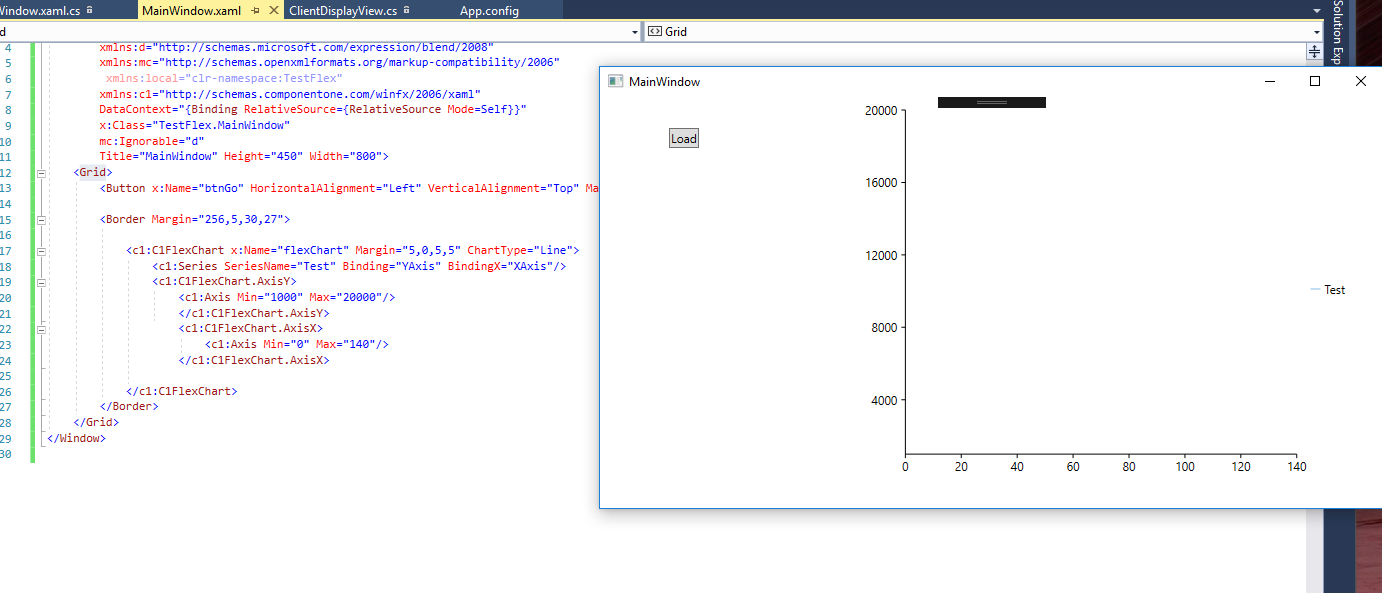
    The chart loads fine. But if I add a Yaxis min, max, it displays an empty chart.:

    c1:C1FlexChart.AxisY

    <c1:Axis Min=“4000” Max=“20000”/>

    </c1:C1FlexChart.AxisY>

  • Posted 22 July 2019, 2:32 am EST

    Never mind on this. The background data I tested with shifted outside the min max Y values. The chart control is working fine.

Need extra support?

Upgrade your support plan and get personal unlimited phone support with our customer engagement team

Learn More

Forum Channels