Background:
To add a range table from a data source, utilize the addFromDataSource method and specify the row and column index and a data source.
Steps to Complete:
1. Initialize SpreadJS
2. Create sample data array
3. Add a table from data source
Getting Started:
Step 1: Initialize SpreadJS
Initialize SpreadJS using new GC.Spread.Sheets.Workbook and targeting an HTML DOM
Get the active sheet using getActiveSheet method.
  <script>
    window.onload = function () {
    // 1. Initialize SpreadJS
    var spread = new GC.Spread.Sheets.Workbook(document.getElementById("ss"));

      // 1. Get the active sheet
      var sheet = spread.getActiveSheet();
    };
  </script>
Step 2: Create sample data array
For this example, we will add the following data array and store it in the variable dataArray.
{ Name: "Mike", Age: 23, Position: "Point Guard" },
{ Name: "Dave", Age: 22, Position: "Shoot Guard" },
{ Name: "Michael", Age: 21, Position: "Small Forward" },
{ Name: "Trey", Age: 22, Position: "Power Forward" },
{ Name: "Steve", Age: 21, Position: "Center" }
Here is an example:
<script>
    window.onload = function () {
    // 1. Initialize SpreadJS
    var spread = new GC.Spread.Sheets.Workbook(document.getElementById("ss"));
    // 1. Get the active sheet
    var sheet = spread.getActiveSheet();
      // 2. Create data array with basketball team players
      var dataArray = [
        { Name: "Mike", Age: 23, Position: "Point Guard" },
        { Name: "Dave", Age: 22, Position: "Shoot Guard" },
        { Name: "Michael", Age: 21, Position: "Small Forward" },
        { Name: "Trey", Age: 22, Position: "Power Forward" },
        { Name: "Steve", Age: 21, Position: "Center" },
      ];
    };
  </script>
Step 3: Add a table from data source
Add a range table from the data source using SpreadJS’s addFromDataSource method and store it in the variable called table.
Use the following parameters to create the table:
Table Name: table
row:0
col:0,
data source: dataArray
style: dark1
The final script tag should appear as so:
<script>
    window.onload = function () {
      // 1. Initialize SpreadJS
     var spread = new GC.Spread.Sheets.Workbook(document.getElementById("ss"));

      // 1. Get the active sheet
      var sheet = spread.getActiveSheet();

      // 2. Create data array with basketball team players
      var dataArray = [
        { Name: "Mike", Age: 23, Position: "Point Guard"},
        { Name: "Dave", Age: 22, Position: "Shoot Guard" },
        { Name: "Michael", Age: 21, Position: "Small Forward" },
        { Name: "Trey", Age: 22, Position: "Power Forward" },
        { Name: "Steve", Age: 21, Position: "Center" },
      ];

      // 3. Add table from data source
      var table = sheet.tables.addFromDataSource(
        "table",
        0,
        0,
        dataArray,
        GC.Spread.Sheets.Tables.TableThemes.dark1
      );
    };
  </script>
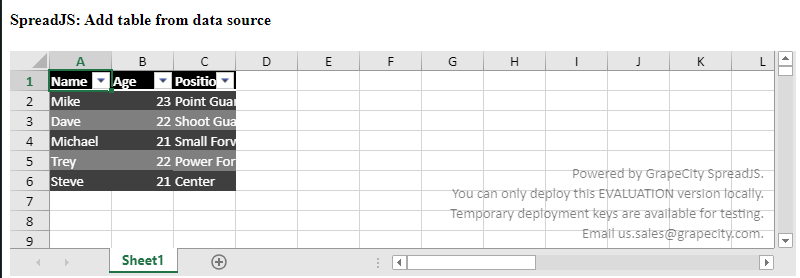
Outcome:
A table is now created from the data source dataArray and should appear with the dark1 table theme:
Tags:
Mackenzie Albitz