JavaScript Data Visualization with SpreadJS Sparklines
- Display trends in a minimal area using this alternative to standard charts
- Visualize a group of data by placing a sparkline in a spreadsheet cell
- Provide a graphical representation of your data using a variety of sparkline types
Overview
SpreadJS provides many options to improve data visualization – one option is sparklines. Sparklines provide a graphical representation of your data in a single cell. Embed these small charts into any cell to quickly show trends in your data, such as increases and decreases, minimum and maximum values, stock levels, costs, and more.
Easily Identify Data Trends with Sparklines

Horizontal Cascade
Show how transactions change between a starting and ending value with vertical or horizontal bars to display data and data values.

Vertical Cascade
Easily compare data and data values. Provide a clear structure to display gradual changes in the quantitative value of something over time.
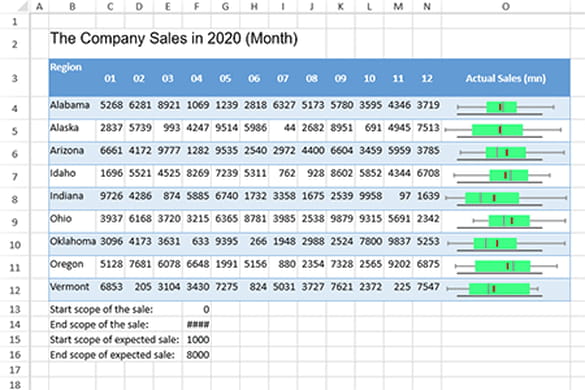
Horizontal BoxPlot
A boxplot sparkline uses horizontal quartiles to show the variability of numerical datasets.
Vertical BoxPlot
A boxplot sparkline uses vertical quartiles to show the variability of numerical datasets.

Horizontal Bullet
The horizontal bullet graph can serve as a replacement for gauges and meters in dashboards because of its ability to convey large amounts of information in a compact space.

Vertical Bullet
Use the vertical bullet graph to display multiple measures of your data. These charts are also a space-saving visualization tool used to measure progress towards a goal or target.


Horizontal Pareto
The Horizontal Pareto sparkline is widely used in logistics to optimize stock levels and cost. It highlights the most critical items in a set of values using various display options, including horizontal, vertical, bar, and column. A Pareto sparkline helps segregate problems and causes.

Vertical Pareto
A Vertical Pareto sparkline is a sorted histogram where the columns are sorted in descending order, and a line represents the cumulative total percentage. It enables users to visualize information quickly and can be used as an excellent communication tool.

Pie Sparkline
A pie sparkline is a circular graph that is divided into slices to illustrate numeric proportions. Pie sparklines make it easier to visualize percentages of data and how it compares to other information.

Lollipop Variance Sparkline
Efficiently analyze absolute and relative variances with SpreadJS's Lollipop Variance Sparkline. Tailor colors and settings to streamline data presentation, offering a powerful tool for in-depth data trend interpretation.

Area Sparkline
Area charts are commonly used to showcase data that depict a time-series relationship. Data in an area chart is plotted on the x- and y-axis, and data values are plotted using data points that are connected using line segments.

Scatter Sparklines
Scatter sparklines can compare numeric values, such as scientific, statistical, and engineering data.

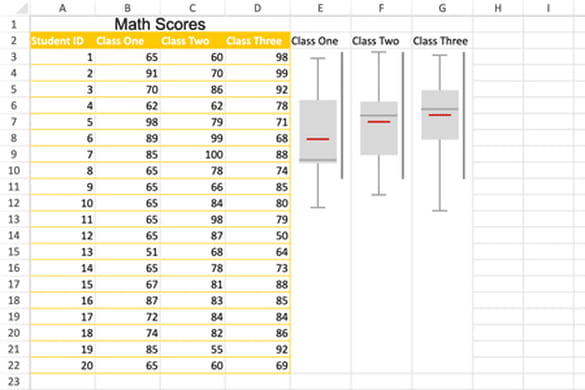
Spread Sparkline
You can use the spread sparkline to show the statistical spread of a data set with an average line, including the data distribution of student grades.

Stacked Sparkline
A stacked sparkline shows a detailed breakdown of an aggregated value. This could include a sales breakdown by product or expenses by department.

Vari Sparkline
A vari sparkline shows a value as either a positive or negative variance bar. It's mainly used in financial reports to plot the budget and actual variance or YoY variance.

Excel Compatible
SpreadJS supports built-in Excel sparklines, such as line, column, and win-loss sparklines.

Custom Sparkline
Write functions to create custom data visualizations, such as a live world clock or a graphical representation of your data.

Month Sparkline
A month sparkline provides a heatmap plot of daily data points in a single month block to potentially show sales data, site traffic data, and more.


