A polar plot area contains series that have values in two dimensions (angle and radius). When visualized in two dimensions, a polar plot area takes the form of a circle with a circular x-axis representing angle values and a radial y-axis representing radius values. When visualized in three dimensions, a polar plot area takes the form of a disk with a circular x-axis representing an angle value and a radial y-axis representing a radius value.
A polar series is displayed in a polar plot area. Points have value(s) in two dimensions: x (angle) and y (radius). If a polar plot area has multiple y-axes then a series can be assigned to a specific axis using the axis's ID. There are several subtypes of polar series: polar point, polar line, polar area, and polar stripe.
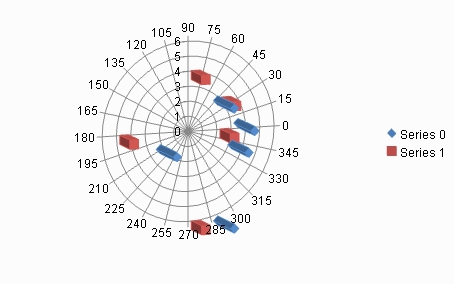
The following image shows a three dimensional polar point chart that was created by using the Elevation, Rotation, and ViewType properties. The Depth property in the plot area class was used to add depth to the point markers.
You can have any of these types of Polar plots:
For details on the API, refer to the PolarPlotArea class.