A radar plot area contains series that have values in one dimension. When visualized in two dimensions, a radar plot area takes the form of an n-sided polygon with a circular x-axis representing categories and a radial y-axis representing values. When visualized in three dimensions, a radar plot area takes the form of an n-sided disk with a circular x-axis representing categories and a radial y-axis representing values.
A radar series is displayed in a radar plot area. Each point has value(s) in one dimension: y (radius). If a plot area has multiple y-axes then a series can be assigned to a specific axis using the axis's ID. There are several subtypes of radar series: radar point, radar line, radar area, and radar stripe.
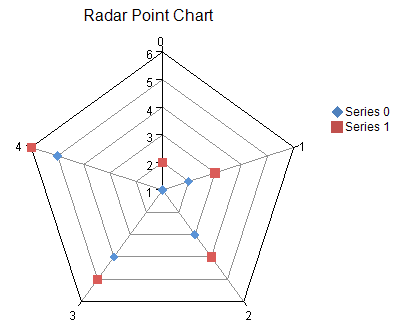
You can have any of these types of Radar plots:
For details on the API, refer to the RadarPlotArea class.