You can open the designer by right-clicking on the control and then selecting Spread Designer from the menu. Click on the Insert tab to bring up the Chart options. Click on one of the chart types to bring up the Insert Chart dialog.
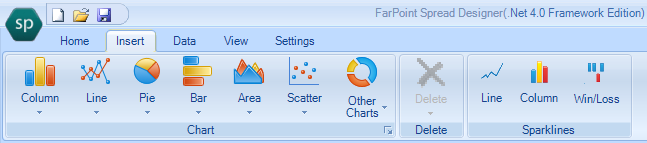
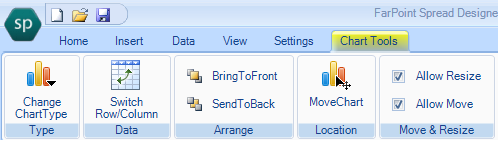
You can use the Insert Chart dialog to add a chart. Select a chart type and then click OK. The chart is placed in the middle of the current sheet view and the Chart Tools dialog is displayed.
The Chart Tools dialog can be used to make changes to the chart (move, resize, change the chart type, and so on).
You can type data in the designer before adding a chart or you can add data after adding a chart. If you add the Chart control first, you can then right click on the Chart control and select the Chart Designer from the context menu to add data.
If you select a cell range and then add the chart, that data is used in creating the chart. If you select a cell, the control will auto-detect a cell range based on the selected cell. If you do not select a cell or cells(s), an empty chart is created.
For more information about the Chart context menu, see Using the Chart Context Menu.