A wall is the area (or plane) behind, below, or to the side of a chart.
A wall can have a border, fill effect, or width (measured in model units). The wall can be visible or hidden. The axis grids (major and minor) and stripes are painted on the walls. The axis grid lines (major and minor) are painted over the axis stripes.
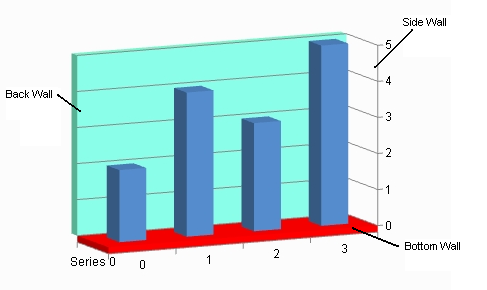
The following image displays a chart with back, bottom, and side walls.
See the following classes for more information on how to set properties for walls:
Use properties in the plot area classes to set options for the walls.
The following example sets properties for the wall.
| C# |
Copy Code
|
|---|---|
YPlotArea plotArea = new YPlotArea(); plotArea.BackWall.Visible = true; |
|
| VB |
Copy Code
|
|---|---|
Dim plotArea As New FarPoint.Web.Chart.YPlotArea() plotArea.BackWall.Visible = True |
|