The XYZ plot area contains series that have values in three dimensions. When visualized in two dimensions, the XYZ plot area takes the form of a rectangle with a horizontal x-axis representing values and a vertical y-axis representing values. When visualized in three dimensions, the XYZ plot area takes the form of a cube with a horizontal x-axis representing values, a vertical y-axis representing values, and a depth z-axis representing values.
The Elevation and Rotation properties in the plot area class can be used to make the z-axis visible.
If an XYZ plot area has multiple x, y, or z-axes then the series can be assigned to a specific axis using the axis's ID. There are several subtypes of XYZ series: XYZ point, XYZ line, XYZ surface, and XYZ stripe.
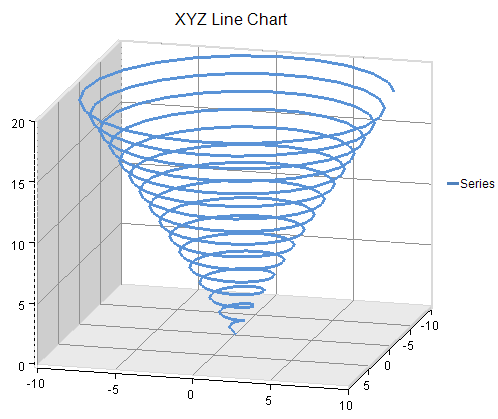
You can have any of these types of XYZ plots: