Spread ASP.NET 17
Spread for ASP.NET 17 Product Documentation / Developer's Guide / Customizing User Interaction / Customizing Interaction with Cells / Using Conditional Formatting in Cells / Creating Conditional Formatting with Rules / Color Scale Rules
In This Topic
    Color Scale Rules
    In This Topic

    Color scales are visual guides that help you understand data distribution and variation. A two-color scale compares a range of cells by using a gradation of two colors. The shade of the color represents higher or lower values. For example, in a green and red color scale, you can specify that higher value cells are closer to a green color and lower value cells are closer to a red color. You can specify the value type, value, and color for the minimum and maximum properties.

    A three-color scale compares a range of cells by using a gradation of three colors. The shade of the color represents higher, middle, or lower values. For example, in a green, yellow, and red color scale, you can specify that higher value cells have a green color, middle value cells have a yellow color, and lower value cells have a red color. You can specify the value type, value, and color for the minimum, middle, and maximum properties.

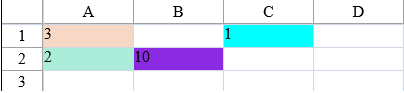
    The following image uses the three color rule:

    Three color scale rule

    Using Code

    Set the properties of the TwoColorScaleConditionalFormattingRule class or the ThreeColorScaleConditionalFormattingRule class and then apply the formatting.

    Example

    This example code creates a three color rule and uses the SetConditionalFormatting method to apply the rule.

    C#
    Copy Code

    protected void Page_Load(object sender, System.EventArgs e)
    {
    FpSpread1.Sheets[0].Cells[0, 0].Value = 3;
    FpSpread1.Sheets[0].Cells[1, 0].Value = 2;
    FpSpread1.Sheets[0].Cells[1, 1].Value = 10;
    FpSpread1.Sheets[0].Cells[0, 2].Value = 1;
    }

    protected void Button1_Click(object sender, EventArgs e)
    {
    FarPoint.Web.Spread.Model.CellRange celRange1 = new FarPoint.Web.Spread.Model.CellRange(0, 0, 3, 3);
    FarPoint.Web.Spread.ThreeColorScaleConditionalFormattingRule rule = new FarPoint.Web.Spread.ThreeColorScaleConditionalFormattingRule(Color.Aqua, Color.Bisque, Color.BlueViolet);
    FpSpread1.Sheets[0].SetConditionalFormatting(new FarPoint.Web.Spread.Model.CellRange[] { celRange1 }, rule);
    }

    VB
    Copy Code

    Private Sub Page_Load(ByVal sender As System.Object, ByVal e As System.EventArgs) Handles MyBase.Load
    FpSpread1.Sheets(0).Cells(0, 0).Value = 3
    FpSpread1.Sheets(0).Cells(1, 0).Value = 2
    FpSpread1.Sheets(0).Cells(1, 1).Value = 10
    FpSpread1.Sheets(0).Cells(0, 2).Value = 1
    End Sub

    Protected Sub Button1_Click(sender As Object, e As EventArgs) Handles Button1.Click
    Dim celRange1 As New FarPoint.Web.Spread.Model.CellRange(0, 0, 3, 3)
    Dim rule As New FarPoint.Web.Spread.ThreeColorScaleConditionalFormattingRule(Drawing.Color.Aqua, Drawing.Color.Bisque, Drawing.Color.BlueViolet)
    FpSpread1.Sheets(0).SetConditionalFormatting(New FarPoint.Web.Spread.Model.CellRange() {celRange1}, rule)
    End Sub

    Using the Spread Designer

    1. In the work area, select the cell or cells for which you want to set the conditional format.
    2. Under the Home menu, select the Conditional Formatting icon in the Style section, then select the Color Scales option, and then choose the color set.
    3. From the File menu choose Apply and Exit to apply your changes to the component and exit Spread Designer.