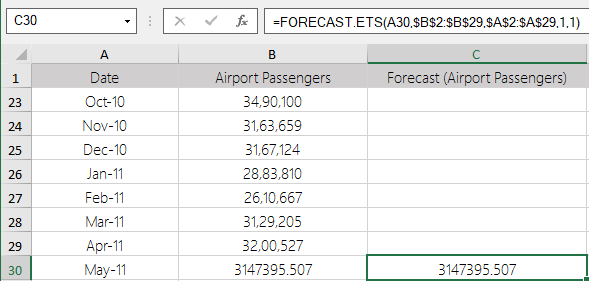
This function calculates or predicts a future value based on existing values by using the AAA version of the Exponential Triple Smoothing (ETS) algorithm.
=FORECAST.ETS(target_date,values,timeline,[seasonality],[data_completion],[aggregation])
The function has the following arguments:
|
Argument |
Description |
||||||||||||||||
|---|---|---|---|---|---|---|---|---|---|---|---|---|---|---|---|---|---|
|
target_date |
[Required] is a date for which you want to predict a new value. Must be after the last date in the timeline. | ||||||||||||||||
| values | [Required] is a range of the historical values for which you want to predict a new point. | ||||||||||||||||
| timeline |
[Required] is a range of date/time values that correspond to the historical values. The timeline range must be of the same size as the values range. Date/time values must have a constant step between them (although up to 30% of missing values can be processed as specified by the data_completion argument and duplicate values can be aggregated as specified by the aggregation argument). |
||||||||||||||||
| seasonality |
[Optional] is a numeric value that specifies which method should be used to detect the seasonality. The possible values are listed below.
|
||||||||||||||||
| data_completion |
[Optional] is a numeric value that specifies how to process the missing data points in the timeline data range. The possible values are listed below.
|
||||||||||||||||
| aggregation |
[Optional] is a numeric value that specifies which function should be used to aggregate identical time values in the timeline data range. The possible values are listed below.
|
This function requires the timeline to be organized with a constant step between the different points. For example, that could be a monthly timeline with values on the 1st of every month, a yearly timeline, or a timeline of numerical indices. For this type of timeline, it’s very useful to aggregate raw detailed data before you apply the forecast, which produces more accurate forecast results as well.
Returns a specified statistical value relating to a time series.
This function is available in product version 16.0 or later.