This function returns the length of the repetitive pattern the application detects for the specified time series.
=FORECAST.ETS.SEASONALITY(values,timeline,[data_completion],[aggregation])
The function has the following arguments:
|
Argument |
Description |
||||||||||||||||
|---|---|---|---|---|---|---|---|---|---|---|---|---|---|---|---|---|---|
| values | [Required] is a range of the historical values for which you want to predict a new point. | ||||||||||||||||
| timeline |
[Required] is a range of date/time values that correspond to the historical values. The timeline range must be of the same size as the values range. Date/time values must have a constant step between them. |
||||||||||||||||
| data_completion |
[Optional] is a numeric value that specifies how to process the missing data points in the timeline data range. The possible values are listed below.
|
||||||||||||||||
| aggregation |
[Optional] is a numeric value that specifies which function should be used to aggregate identical time values in the timeline data range. The possible values are listed below.
|
While it can also be used independently of FORECAST.ETS, the functions are tied since the seasonality detected in this function is identical to the one used by FORECAST.ETS, considering the same input parameters that affect data completion.
Returns a specified statistical value relating to a time series.
Quarterly seasonality
For quarterly seasonality, we use the timeline of a fiscal year, and the value of the seasonality will be 4, as the financial year is divided into four parts of 3 months, which is called 'a quarter' of a fiscal year.
For example, the worksheet shows a set of monthly passenger traffic between Jan-2009 and May 2010. The FORECAST.ETS.SEASONALITY function can be used to forecast the length of the seasonal pattern in the time period between April 2009 and May 2010.
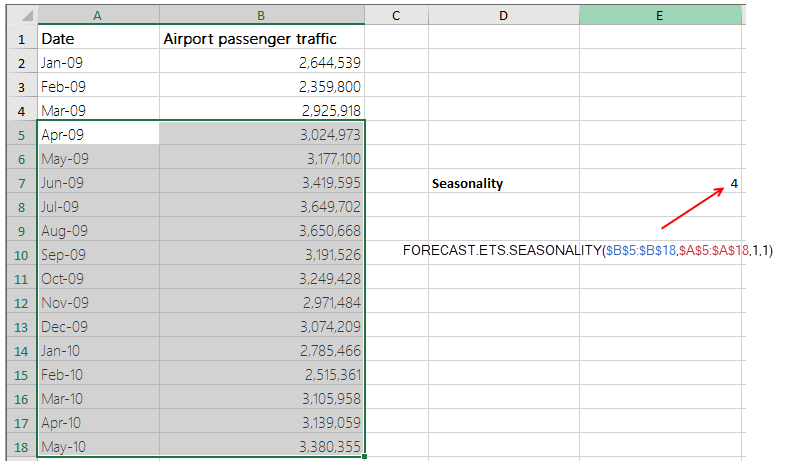
That is cell E7 has the formula FORECAST.ETS.SEASONALITY($B$5:$B$18,$A$5:$A$18,1,1), and it gives the result 4.
Monthly seasonality
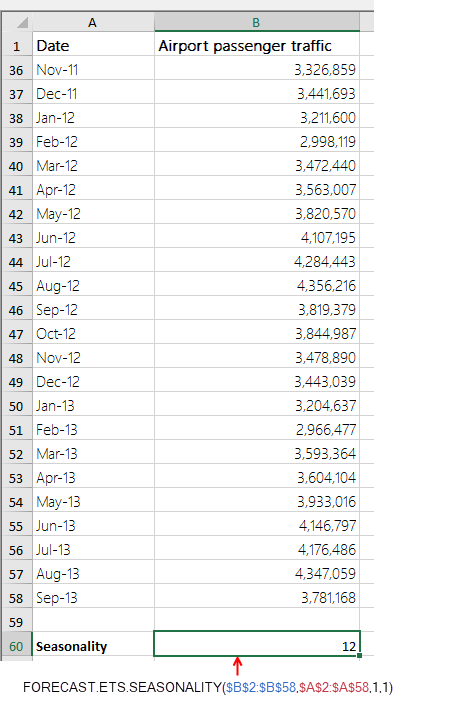
In monthly seasonality, we take the timeline for several years of data, so that the value returned by the function be approximately 12.
For example, the worksheet shows a set of monthly passenger traffic between Jan-2009 and Sep 2013, that is a time span of 3 years. The FORECAST.ETS.SEASONALITY function can be used to forecast the length of the seasonal pattern in this time period, and the value obtained is 12.
Note that the calculated seasonality value will have greater accuracy depending upon the number of data values that are supplied to the function. That is, more the number of data values, better the accuracy.
This function is available in product version 16.0 or later.