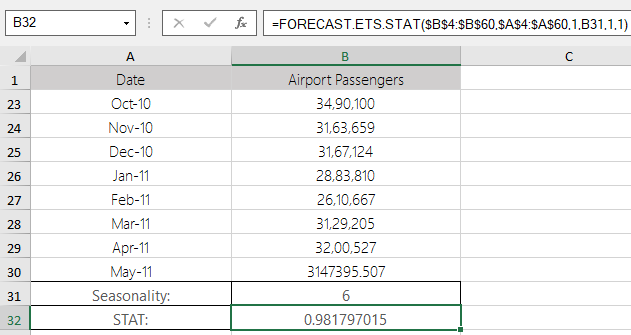
This function return a statistical value as a result of time series forecasting. Statistic type indicates which statistic is requested by this function.
=FORECAST.ETS.STAT(values,timeline,statistic_type,[seasonality],[data_completion],[aggregation])
The function has the following arguments:
|
Argument |
Description |
|||||||||||||||||||||||||||
|---|---|---|---|---|---|---|---|---|---|---|---|---|---|---|---|---|---|---|---|---|---|---|---|---|---|---|---|---|
| values | [Required] is a range of the historical values for which you want to predict a new point. | |||||||||||||||||||||||||||
| timeline |
[Required] is a range of date/time values that correspond to the historical values. The timeline range must be of the same size as the values range. Date/time values must have a constant step between them. |
|||||||||||||||||||||||||||
| statistic_type |
[Required] A numeric value between 1 and 8, indicating which statistic will be returned for the calculated forecast. The table below shows the eight possible statistical values and their corresponding results.
|
|||||||||||||||||||||||||||
| seasonality |
[Optional] is a numeric value that specifies which method should be used to detect the seasonality. The possible values are listed in the table below.
|
|||||||||||||||||||||||||||
| data_completion |
[Optional] is a numeric value that specifies how to process the missing data points in the timeline data range. The possible values are listed below.
|
|||||||||||||||||||||||||||
| aggregation |
[Optional] is a numeric value that specifies which function should be used to aggregate identical time values in the timeline data range. The possible values are listed below.
|
Returns a specified statistical value relating to a time series.
This function is available in product version 16.0 or later.