Spread for WinForms supports Forecast Sheet dialog, a UI feature that is useful for predicting numerical data. Forecasting helps in predicting the future data based on the past data trend. You can use it to predict consumer trends, future sales or inventory requirements.
Forecast-sheet
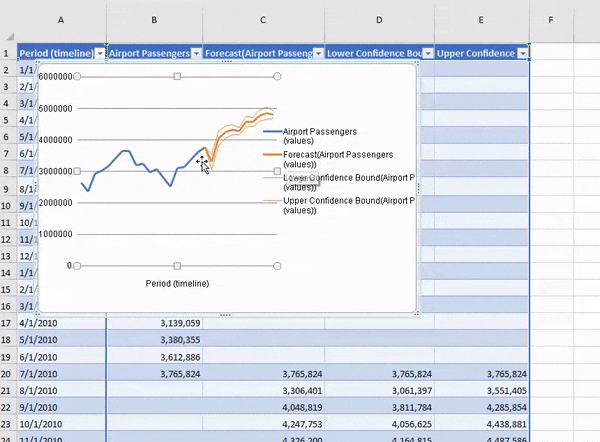
For analyzing a forecast, the Spread Designer creates a new worksheet that contains both a table of the historical and predicted values, and a chart that expresses this data. The data table depicts the Forecast Sales, Lower Confidence Bound, and Upper Confidence Bound. Likewise, the chart control plots the timeline across x-axis and values across y-axis, and depicts the forecast sales, lower confidence bound and upper confidence bound.
The Forecast Sheet uses the FORECAST.ETS, FORECAST.ETS.CONFINT, FORECAST.ETS.STAT and FORECAST.ETS.SEASONALITY functions for forecasting data in the table and charts. These functions are a big improvement over the FORECAST and FORECAST.LINEAR functions, predicting seasonality, statistics and exponential trends much better.
The FORECAST.ETS functions help to forecast data using exponential triple smoothing algorithm, a statistical method that smoothens time series data. This algorithm is also known as Holt Winters method, and can be used to forecast data points in a series, such that the series is seasonal or repetitive over a period of time.
To learn more about FORECAST formula functions and use them in Spread, see the Formula Reference documentation.
To call on the Forecast Sheet dialog, follow the steps below.
Arrange your data in two columns, one column containing dates and the other column containing historical data or values that corresponds to the dates, for example, passenger traffic in an airport.
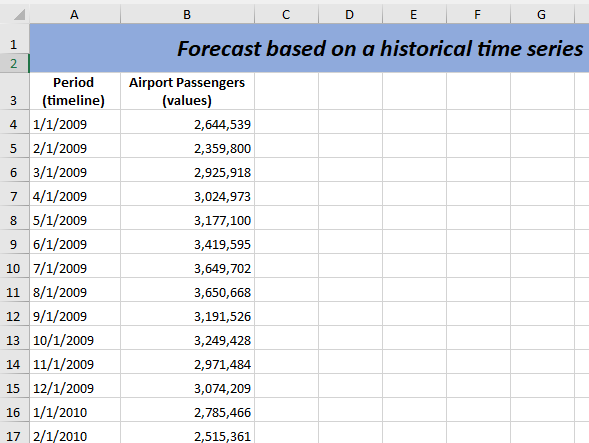
Here, we have taken a time span of two years between 2009 and 2010, and plotted the airport passenger traffic across this timeline.
The data for the forecast can also be in rows, but the row ranges need to be parallel, though not necessarily contiguous. You can also specify two separate and non-contiguous column or row ranges for the forecast data, and these can be multi-selected in the worksheet before calling the Forecast Sheet dialog.
Select both data series.
Click the Forecast Sheet option by navigating to the Forecast group in the Data tab. This invokes the Create Forecast Worksheet dialog.
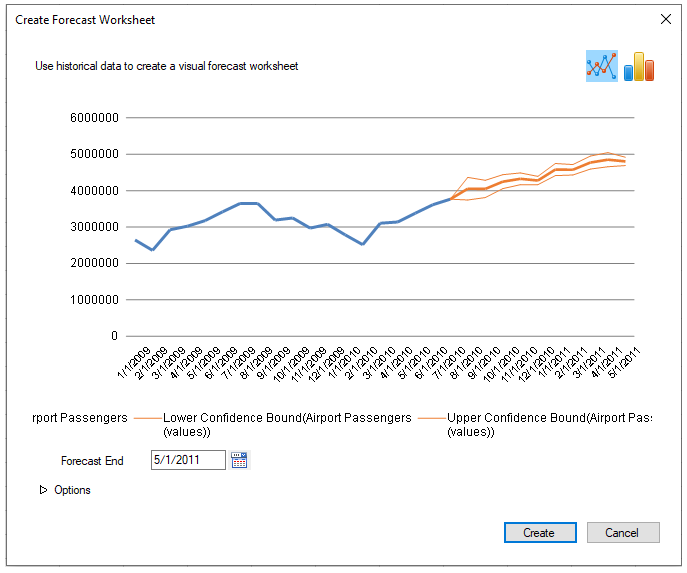
Select a line or column chart from the Create Forecast Worksheet dialog.
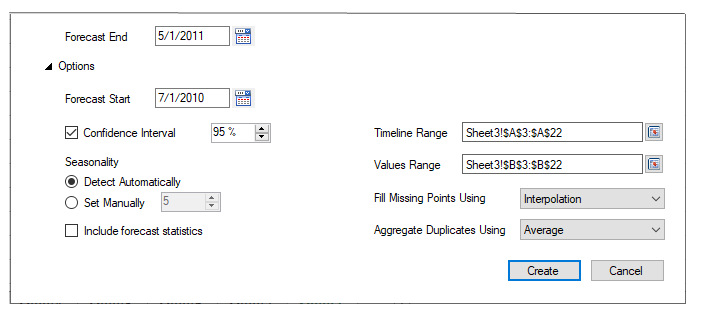
Select an end date from the Forecast End option. The Forecast End and Forecast Start are used to enter the end date and start date of a forecast. The Forecast sheet automatically calculates the end date and start date. You can also enter values manually as per your need. You can also enter more data using the Options drop-down section in the Forecast dialog, such as Confidence Interval, Seasonality, Forecast Statistics checkbox, Timeline Range, Value Range, Aggregation method etc.
Click the Create button. This creates a new Forecast worksheet in the Spread.
The Forecast Sheet dialog provides various options to manipulate or customize the forecast sheet:
Once you create a forecast sheet, you cannot re-open the ‘Create Forecast Worksheet’ dialog box and make changes to the sheet. However, there is a way to customize the existing Forecast sheet, that is, using the FORECAST formulas in the table. A change in the table value is easily reflected in the chart area as well.
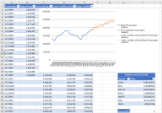
The following image depicts the use of FORECAST formulas in the three columns: Forecast, Lower Confidence Bound and Upper Confidence Bound. The current Forecast values are based on the past data taken between January 2009 and July 2010.
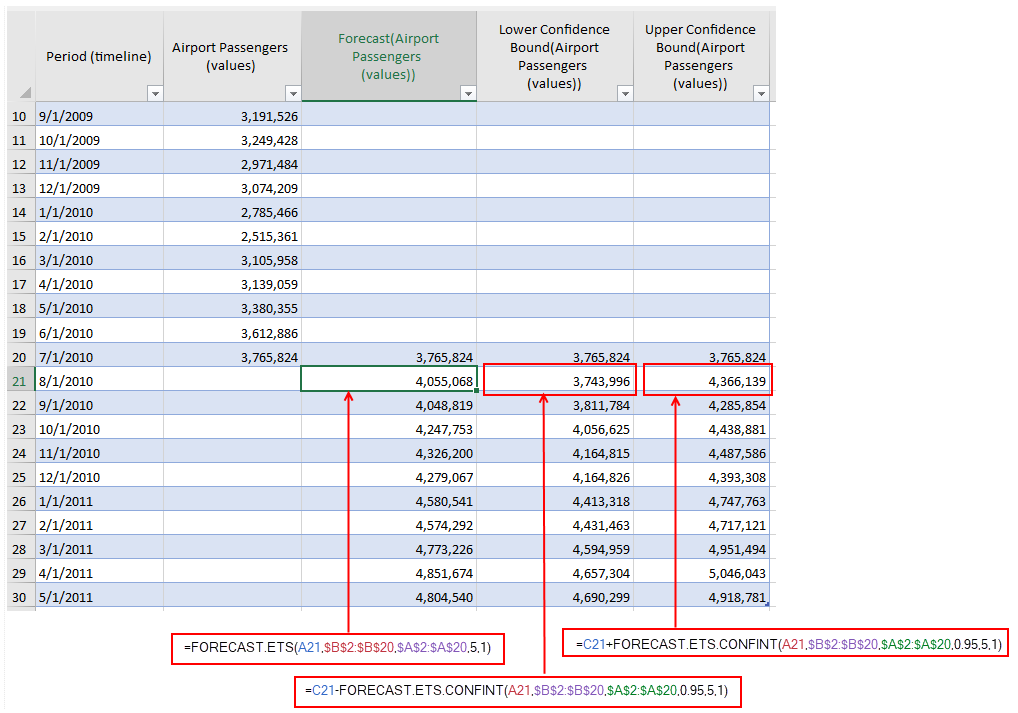
The Forecast column predicts the values based on the FORECAST.ETS function, which predicts a value with a seasonal trend. The other two columns, Lower Confidence Bound and Upper Confidence Bound predicts values based on the FORECAST.ETS.CONFINT function, which return the confidence intervals for a forecast value.
You can tweak the forecast table sheet by editing the ranges being referenced in the formulas of the Forecast columns. This helps you analyze the Forecast values based on a different set of timeline and values. For example, you can update the three Forecast columns, by changing the cell ranges from A2 : A20 and B2 : B20 to A11 : A20 and B11 : B20, respectively. This way you can predict Forecast data based on the past data between October 2009 to July 2010.
Refer to the following image to understand this better.
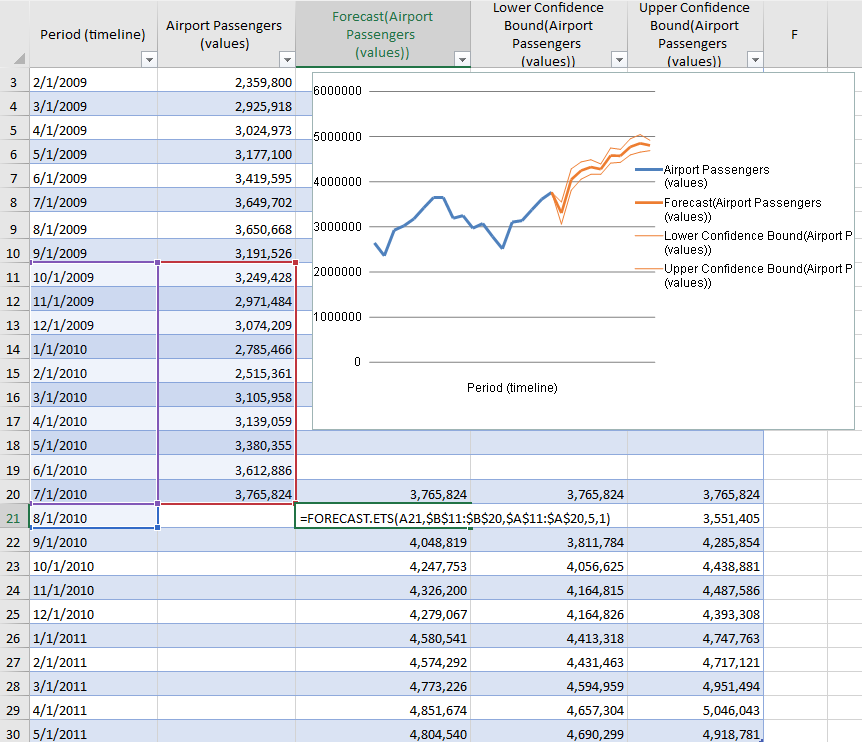
As observed, there is a drift in the forecasted table and chart metrics when you change the ranges in the FORECAST formulas. In this way, you can predict data over different sets of timelines and values, making it very convenient to forecast results to suit your own requirements.
You can also customize the chart by right-clicking the chart area and selecting any option from the chart context menu, for example, you can change chart type, select chart data, move chart, format plot area, view 3D chart, etc.
You can also invoke the Forecast Sheet at runtime using the BuiltInDialogs class. For more information, see Working with BuiltIn Dialogs.