Spread Windows Forms 17
Spread Windows Forms 17.0 Product Documentation / Developer's Guide / Chart Control / Understanding Charts / Plot area / Axis
In This Topic
    Axis
    In This Topic

    An axis is used to display the scale for a single dimension of a plot area. An axis can have a title, a ruler line, major and minor tick marks, tick mark labels, major and minor grid lines, and stripes. The direction of the axis can be reversed. The minimum, maximum, major or minor tick, and label units can be automatically generated or manually assigned. The scale can be linear or logarithmic.

    軸

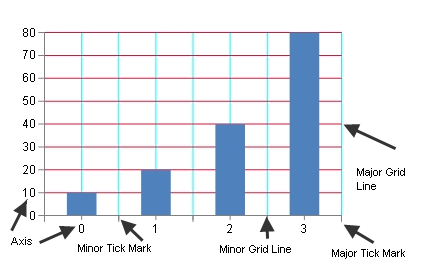
    Tick marks and grids are used to mark individual values on the ruler. Tick marks are painted on the ruler while corresponding grids are painted on the wall(s). Stripes are used to highlight ranges of values. Stripes are painted on the wall(s).

    • The title, ruler, tick marks (major and minor), tick mark labels, and grids (major and minor) can be hidden.
    • A font can be set for the title and tick marks and the title can be customized. The title and tick mark labels can have fill effects.
    • Length (measured in model units), can also be set for major and minor tick marks.
    • The axis can have lines for the ruler, major, and minor grids as well as a minimum and maximum value. The minimum and maximum values can be automatically generated by the chart view.
    • An axis can be assigned a collection of stripes.
    • The direction of the axis can be reversed.

    For more information, see the following classes:

    Example

    The following example sets a title for the axis.

    C#
    Copy Code
    FarPoint.Win.Chart.YPlotArea plotArea = new FarPoint.Win.Chart.YPlotArea();
    plotArea.Location = new PointF(0.2f, 0.2f);
    plotArea.Size = new SizeF(0.6f, 0.6f);
    plotArea.XAxis.Title = "Categories";           
    plotArea.YAxes[0].Title = "Values";
    
    Visual Basic
    Copy Code
    Dim plotArea As New FarPoint.Win.Chart.YPlotArea()
    plotArea.Location = New PointF(0.2F, 0.2F)
    plotArea.Size = New SizeF(0.6F, 0.6F)
    plotArea.XAxis.Title = "Categories"
    plotArea.YAxes(0).Title = "Values"
    

    Using SPREAD Designer

    1. Run the Chart Designer.
    2. Expand the target Plot Area from the tree menu on the left.
    3. Select X Index Axis and set the required properties in the property list on the right.
    4. Expand Y Value Axis, select Axis0 and set the required properties in the property list on the right.
    5. Click OK to exit Chart Designer.
    For information on starting Chart Designer, refer to Chart Designer in the SPREAD Designer Guide.