Multi-level category labels can simultaneously display both the main and subcategory labels present in the Index Axis. You can set the value of the MultiLevel property of the YPlotArea class to true to enable the display of multi-level category labels. By default, this property is set to false.
This feature is compatible with only Column, Line, Bar, and Area charts because these charts have axis that support multiple levels. On importing and exporting Excel format files, the multi-level category labels are maintained.
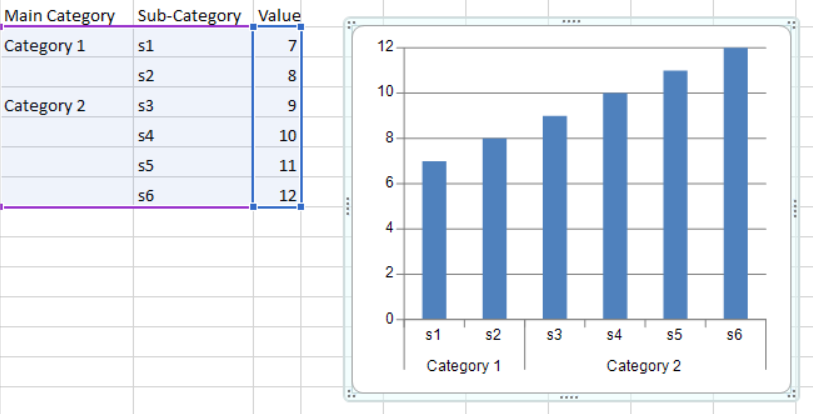
The following image depicts a Column chart with multi-level category labels.
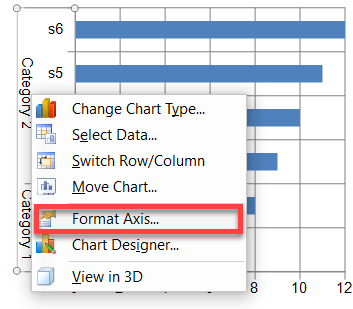
If the IndexAxis labels are oriented vertically in a chart, all category labels appear vertically, except the last subcategory label, which is displayed horizontally.
The following image depicts a Bar chart with multi-level category labels.

The following sample code shows how to display multi-level category labels.
| C# |
Copy Code
|
|---|---|
SheetView sheet1 = fpSpread1.ActiveSheet; sheet1.Cells[1, 1].Value = "s1"; sheet1.Cells[2, 1].Value = "s2"; sheet1.Cells[3, 1].Value = "s3"; sheet1.Cells[4, 1].Value = "s4"; sheet1.Cells[5, 1].Value = "s5"; sheet1.Cells[6, 1].Value = "s6"; sheet1.Cells[1, 2].Value = 7; sheet1.Cells[2, 2].Value = 8; sheet1.Cells[3, 2].Value = 9; sheet1.Cells[4, 2].Value = 10; sheet1.Cells[5, 2].Value = 11; sheet1.Cells[6, 2].Value = 12; sheet1.Cells[1, 0].Value = "Category1"; sheet1.Cells[3, 0].Value = "Category2"; FarPoint.Win.Spread.Model.CellRange range = new FarPoint.Win.Spread.Model.CellRange(1, 0, 6, 3); sheet1.AddChart(range, typeof(BarSeries), 300, 300, 200, 100, ChartViewType.View2D, false); YPlotArea plotArea = (YPlotArea)(fpSpread1.Sheets[0].Charts[0].Model.PlotAreas[0]); plotArea.XAxis.MultiLevel = true; |
|
| VB |
Copy Code
|
|---|---|
Dim sheet1 As SheetView = FpSpread1.ActiveSheet sheet1.Cells(1, 1).Value = "s1" sheet1.Cells(2, 1).Value = "s2" sheet1.Cells(3, 1).Value = "s3" sheet1.Cells(4, 1).Value = "s4" sheet1.Cells(5, 1).Value = "s5" sheet1.Cells(6, 1).Value = "s6" sheet1.Cells(1, 2).Value = 7 sheet1.Cells(2, 2).Value = 8 sheet1.Cells(3, 2).Value = 9 sheet1.Cells(4, 2).Value = 10 sheet1.Cells(5, 2).Value = 11 sheet1.Cells(6, 2).Value = 12 sheet1.Cells(1, 0).Value = "Category1" sheet1.Cells(3, 0).Value = "Category2" Dim range As FarPoint.Win.Spread.Model.CellRange = New FarPoint.Win.Spread.Model.CellRange(1, 0, 6, 3) sheet1.AddChart(range, GetType(BarSeries), 300, 300, 200, 100, ChartViewType.View2D, False) Dim plotArea As YPlotArea = CType((fpSpread1.Sheets(0).Charts(0).Model.PlotAreas(0)), YPlotArea) plotArea.XAxis.MultiLevel = True |
|