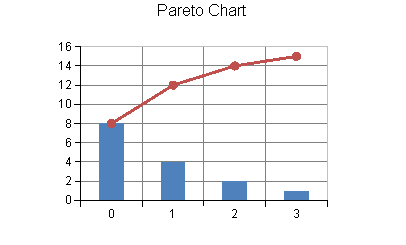
Different types of series are compatible with each other and can be displayed in a single plot area, as long as the main classifications are the same series. For example, you can display bar and line series in the same Y plot area, as shown in the following image.
For more information on the API, see the YPlotArea class. Also, in the above image, the following classes are used to create bar and line series.
The following example demonstrates how to display a bar series and a line series in the same plot area.
| C# |
Copy Code
|
|---|---|
FarPoint.Win.Chart.BarSeries series0 = new FarPoint.Win.Chart.BarSeries(); series0.Values.Add(8.0); series0.Values.Add(4.0); series0.Values.Add(2.0); series0.Values.Add(1.0); FarPoint.Win.Chart.LineSeries series1 = new FarPoint.Win.Chart.LineSeries(); series1.PointMarker = new FarPoint.Win.Chart.BuiltinMarker(FarPoint.Win.Chart.MarkerShape.Circle, 7.0f); series1.Values.Add(8.0); series1.Values.Add(12.0); series1.Values.Add(14.0); series1.Values.Add(15.0); FarPoint.Win.Chart.YPlotArea plotArea = new FarPoint.Win.Chart.YPlotArea(); plotArea.Location = new PointF(0.2f, 0.2f); plotArea.Size = new SizeF(0.6f, 0.6f); plotArea.Series.Add(series0); plotArea.Series.Add(series1); FarPoint.Win.Chart.LabelArea labelArea = new FarPoint.Win.Chart.LabelArea(); labelArea.Location = new PointF(0.5f, 0.02f); labelArea.AlignmentX = 0.5f; labelArea.AlignmentY = 0.0f; labelArea.Text = "Pareto Chart"; FarPoint.Win.Chart.ChartModel model = new FarPoint.Win.Chart.ChartModel(); model.LabelAreas.Add(labelArea); model.PlotAreas.Add(plotArea); chart2DControl1.Model = model; |
|
| Visual Basic |
Copy Code
|
|---|---|
Dim series0 As New FarPoint.Win.Chart.BarSeries() series0.Values.Add(8.0) series0.Values.Add(4.0) series0.Values.Add(2.0) series0.Values.Add(1.0) Dim series1 As New FarPoint.Win.Chart.LineSeries() series1.PointMarker = New FarPoint.Win.Chart.BuiltinMarker(FarPoint.Win.Chart.MarkerShape.Circle, 7.0F) series1.Values.Add(8.0) series1.Values.Add(12.0) series1.Values.Add(14.0) series1.Values.Add(15.0) Dim plotArea As New FarPoint.Win.Chart.YPlotArea() plotArea.Location = New PointF(0.2F, 0.2F) plotArea.Size = New SizeF(0.6F, 0.6F) plotArea.Series.Add(series0) plotArea.Series.Add(series1) Dim labelArea As New FarPoint.Win.Chart.LabelArea() labelArea.Location = New PointF(0.5F, 0.02F) labelArea.AlignmentX = 0.5F labelArea.AlignmentY = 0.0F labelArea.Text = "Pareto Chart" Dim model As New FarPoint.Win.Chart.ChartModel() model.LabelAreas.Add(labelArea) model.PlotAreas.Add(plotArea) chart2DControl1.Model = model |
|