You can create an XY Plot chart using code or the designer. The following image shows an XY Plot point type chart.
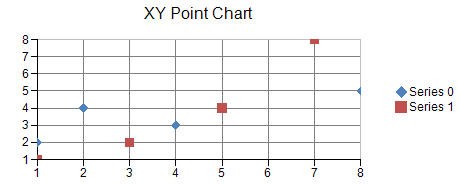
For details on the API, see the XYPlotArea class.
The following classes are also available when creating XY plot type charts:
The following sample code creates a scatter plot (markers only).
| C# |
Copy Code
|
|---|---|
FarPoint.Win.Chart.XYPointSeries series0 = new FarPoint.Win.Chart.XYPointSeries(); series0.SeriesName = "Series 0"; series0.XValues.Add(1.0); series0.XValues.Add(2.0); series0.XValues.Add(4.0); series0.XValues.Add(8.0); series0.YValues.Add(2.0); series0.YValues.Add(4.0); series0.YValues.Add(3.0); series0.YValues.Add(5.0); FarPoint.Win.Chart.XYPointSeries series1 = new FarPoint.Win.Chart.XYPointSeries(); series1.SeriesName = "Series 1"; series1.XValues.Add(1.0); series1.XValues.Add(3.0); series1.XValues.Add(5.0); series1.XValues.Add(7.0); series1.YValues.Add(1.0); series1.YValues.Add(2.0); series1.YValues.Add(4.0); series1.YValues.Add(8.0); FarPoint.Win.Chart.XYPlotArea plotArea = new FarPoint.Win.Chart.XYPlotArea(); plotArea.Location = new PointF(0.2f, 0.2f); plotArea.Size = new SizeF(0.6f, 0.6f); plotArea.Series.Add(series0); plotArea.Series.Add(series1); FarPoint.Win.Chart.LabelArea label = new FarPoint.Win.Chart.LabelArea(); label.Text = "XY Point Chart"; label.Location = new PointF(0.5f, 0.02f); label.AlignmentX = 0.5f; label.AlignmentY = 0.0f; FarPoint.Win.Chart.LegendArea legend = new FarPoint.Win.Chart.LegendArea(); legend.Location = new PointF(0.98f, 0.5f); legend.AlignmentX = 1.0f; legend.AlignmentY = 0.5f; FarPoint.Win.Chart.ChartModel model = new FarPoint.Win.Chart.ChartModel(); model.LabelAreas.Add(label); model.LegendAreas.Add(legend); model.PlotAreas.Add(plotArea); chart2DControl1.Model = model; |
|
| Visual Basic |
Copy Code
|
|---|---|
Dim series0 As New FarPoint.Win.Chart.XYPointSeries() series0.SeriesName = "Series 0" series0.XValues.Add(1.0) series0.XValues.Add(2.0) series0.XValues.Add(4.0) series0.XValues.Add(8.0) series0.YValues.Add(2.0) series0.YValues.Add(4.0) series0.YValues.Add(3.0) series0.YValues.Add(5.0) Dim series1 As New FarPoint.Win.Chart.XYPointSeries() series1.SeriesName = "Series 1" series1.XValues.Add(1.0) series1.XValues.Add(3.0) series1.XValues.Add(5.0) series1.XValues.Add(7.0) series1.YValues.Add(1.0) series1.YValues.Add(2.0) series1.YValues.Add(4.0) series1.YValues.Add(8.0) Dim plotArea As New FarPoint.Win.Chart.XYPlotArea() plotArea.Location = New PointF(0.2F, 0.2F) plotArea.Size = New SizeF(0.6F, 0.6F) plotArea.Series.Add(series0) plotArea.Series.Add(series1) Dim label As New FarPoint.Win.Chart.LabelArea() label.Text = "XY Point Chart" label.Location = New PointF(0.5F, 0.02F) label.AlignmentX = 0.5F label.AlignmentY = 0.0F Dim legend As New FarPoint.Win.Chart.LegendArea() legend.Location = New PointF(0.98F, 0.5F) legend.AlignmentX = 1.0F legend.AlignmentY = 0.5F Dim model As New FarPoint.Win.Chart.ChartModel() model.LabelAreas.Add(label) model.LegendAreas.Add(legend) model.PlotAreas.Add(plotArea) Chart2DControl1.Model = model |
|