The XYZ plot area contains series that have values in three dimensions. When visualized in 2D, the XYZ plot area takes the form of a rectangle with a horizontal x-axis representing values and a vertical y-axis representing values. When visualized in 3D, the XYZ plot area takes the form of a cube with a horizontal x-axis representing values, a vertical y-axis representing values, and a depth z-axis representing values.
The Elevation and Rotation properties in the plot area class can be used to make the z-axis visible.
If an XYZ plot area has multiple x, y, or z-axes then the series can be assigned to a specific axis using the axis's ID. There are three subtypes of XYZ series: XYZ point, XYZ line, and XYZ surface.
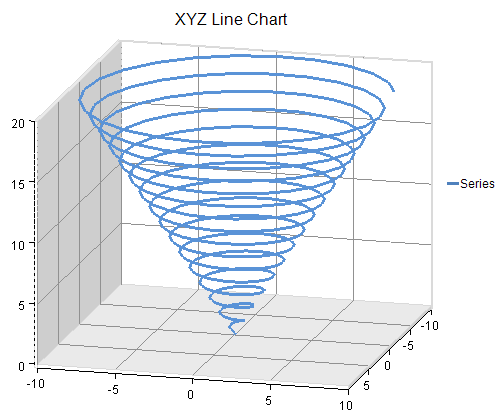
The figure below is an example of an XYZ Line Chart.
You can have any of these types of XYZ plots.
For details on the API, see the XYZPlotArea class.