The point chart can be a basic one-dimensional Cartesian plot such as the one shown in this figure:
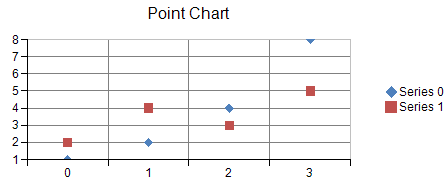
A point marker is used to visualize each data value. Each point in a point series contains a single data value.
A point series can be assigned a border, fill effect, shape, size, and depth for the point markers. Assigning a null for the border or fill effect indicates that the property is unset. Size is measured in model units. Depth is measured relative to the floor of the grid cell (0 = no width, 1 = width of floor grid cell).
Each point in a point series can also be assigned a border and a fill effect for the point marker.
For more information on the point series object in the API, refer to the PointSeries class.
You can have any of these types of point charts, which represent different ways of displaying the series data.
The stacked point chart shows the points vertically stacked.
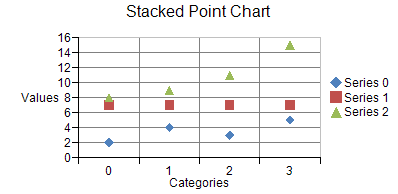
A stacked point series is a composite series that groups together two or more point series.
A stacked point series can have a border, fill effect, size, or depth for the point markers. You can also specify whether the group should be displayed as 100% stacked. Assigning null for a border or fill effect indicates that the property is unset. Size is measured in model units. Depth is measured relative to the depth of floor grid cell (0 = no depth, 1 = depth of floor grid cell).
Each point series in a stacked point series can be assigned a border and fill effect for point makers. Each point in a point series has a single data value. The data value is visualized as a point marker.
Each point in a point series in a stacked point series can be assigned a border and a fill effect for the point marker.
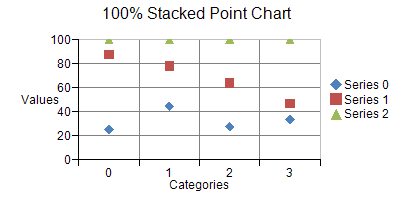
The stacked 100% point chart shows the points vertically stacked and spread all the way to the top (100%) but spread proportionately; otherwise, it is similar to a stacked point chart.