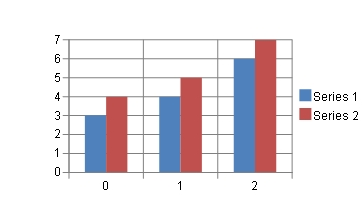
The chart display format can be specified in 2D or 3D. The following image shows a 2D chart.
The following image shows an example of a 3D chart.
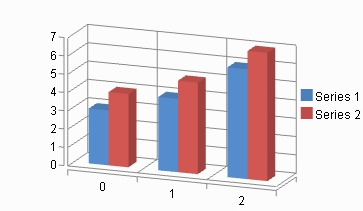
Set the ViewType property of the SpreadChart class that represents the chart. Also, you can rotate the plot area around the horizontal and vertical axes as required. You can set the rotation angle around the horizontal axis with the Elevation property of the PlotArea class and the vertical axis with the Rotation property.
The following example demonstrate how to set the chart display format to 3D.
| C# |
Copy Code
|
|---|---|
FarPoint.Win.Spread.Chart.SpreadChart chart = new FarPoint.Win.Spread.Chart.SpreadChart();
chart.ViewType = FarPoint.Win.Chart.ChartViewType.View3D;
|
|
| Visual Basic |
Copy Code
|
|---|---|
Dim chart As New FarPoint.Win.Spread.Chart.SpreadChart() chart.ViewType = FarPoint.Win.Chart.ChartViewType.View3D |
|
You can also select a chart on the SPREAD designer and set the ViewType from the View section of the property list on the right side of the screen.