Pie sparkline is a circular statistical diagram, which is divided into slices to illustrate numerical proportion. This sparkline makes it easier to see the percentages of data points compared to the entire set of data.

The pie sparkline formula has the following syntax:
=PIESPARKLINE(percentage, [color1, color2, ...])
The formula options are described below where only 'percentage' is the required argument:
| Option | Description |
| percentage | A value that represents the range of data sources. |
|
color1, color2, ... Optional |
Strings that represent the sequence of colors for the pie slices. |
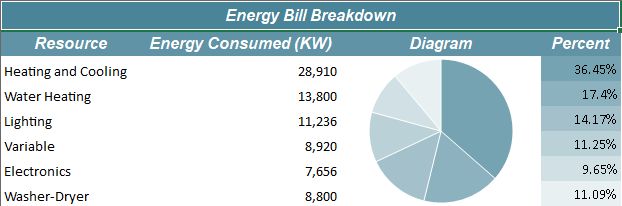
Consider a scenario where a company analyzes its energy consumption in a month. It wants to display the key areas where it can improve on energy conservation. A pie sparkline can showcase the proportions of different consumption factors in the office campus.
| C# |
Copy Code
|
|---|---|
// Get sheet var worksheet = fpSpread1_Sheet1.AsWorksheet(); // Set data for sparkline worksheet.SetValue(1, 0, new object[,] { { "Resource", "Energy Consumed (KW)", "Diagram", "Percent" }, { "Heating and Cooling", 28910, null, null }, { "Water Heating", 13800, null, null }, { "Lighting", 11236, null, null }, { "Variable", 8920, null, null }, { "Electronics", 7656, null, null }, { "Washer-Dryer", 8800, null, null } }); // Merge cells of column C worksheet.Cells["C3:C8"].Merge(); // Apply formula for PieSparkline worksheet.Cells["C3"].Formula = "PIESPARKLINE(B3:B8,\"#76a3b2\",\"#8db2bf\",\"#a4c1cb\",\"#bbd1d8\",\"#d1e0e5\",\"#e8f0f2\")"; |
|
| Visual Basic |
Copy Code
|
|---|---|
'Get sheet Dim worksheet = FpSpread1_Sheet1.AsWorksheet() 'Set data for sparkline worksheet.SetValue(1, 0, New Object(,) { {"Resource", "Energy Consumed (KW)", "Diagram", "Percent"}, {"Heating and Cooling", 28910, Nothing, Nothing}, {"Water Heating", 13800, Nothing, Nothing}, {"Lighting", 11236, Nothing, Nothing}, {"Variable", 8920, Nothing, Nothing}, {"Electronics", 7656, Nothing, Nothing}, {"Washer-Dryer", 8800, Nothing, Nothing}}) 'Merge cells of column C worksheet.Cells("C3:C8").Merge() 'Apply formula for PieSparkline worksheet.Cells("C3").Formula = "PIESPARKLINE(B3:B8,""#76a3b2"",""#8db2bf"",""#a4c1cb"",""#bbd1d8"",""#d1e0e5"",""#e8f0f2"")" |
|

You can also set additional sparkline settings in the dialog if available.