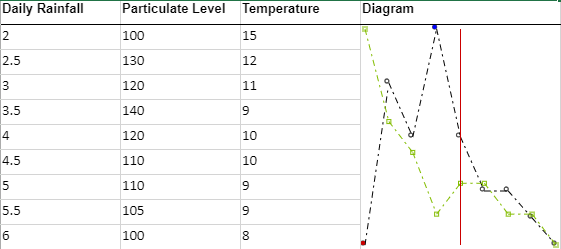
Scatter sparklines plots numerical data, with one variable on each axis, to visualize correlations between them. It can also be used to compare numeric values, such as scientific, statistical, and engineering data as shown in the image below.
The scatter sparkline formula has the following syntax:
=SCATTERSPARKLINE(points1, [points2, minX, maxX, minY, maxY, hLine, vLine, xMinZone, xMaxZone, yMinZone, yMaxZone, tags, drawSymbol, drawLines, color1, color2, dash])
The formula options are described below:
| Option | Description |
| points1 | The first xy data series. If the row count is greater than or equal to the column count, use data from the first two columns. The first column contains x-values and the second column contains y-values. If the row count is less than the column count, use data from the first two rows. The first row contains x-values and the second row contains y-values. |
|
points2 Optional |
The second xy data series. If the row count is greater than or equal to the column count, use data from the first two columns. The first column contains x-values and the second column contains y-values. If the row count is less than the column count, use data from the first two rows. The first row contains x-values and the second row contains y-values. |
|
minX Optional |
The x-minimum limit of both series, each series has its own value if it is omitted. |
|
maxX Optional |
The x-maximum limit of both series, each series has its own value if it is omitted. |
|
minY Optional |
The y-minimum limit of both series, each series has its own value if it is omitted. |
|
maxY Optional |
The y-maximum limit of both series, each series has its own value if it is omitted. |
|
hLine Optional |
The horizontal axis position, there is no line if it is omitted. |
|
vLine Optional |
The vertical axis position, there is no line if it is omitted. |
|
xMinZone Optional |
The x-minimum value of the gray zone, there is no grey zone if any of these four parameters are omitted. |
|
xMinZone Optional |
The x-maximum value of the gray zone, there is no grey zone if any of these four parameters are omitted. |
|
yMinZone Optional |
The y-minimum value of the gray zone, there is no grey zone if any of these four parameters are omitted. |
|
yMaxZone Optional |
The y-maximum value of the gray zone, there is no grey zone if any of these four parameters are omitted. |
|
tags Optional |
If this option is true, mark the point at which the y-value is the maximum of the first series as "#0000FF", and mark the point at which the y-value is the minimum of the first series as "#CB0000". This option is false if it is omitted. |
|
drawSymbol Optional |
If this option is true, draw each point as a symbol. The symbol of the first series is a circle, and the symbol of the second series is a square. This option is true if it is omitted. |
|
drawLines Optional |
If this option is true, connect each point with a line by sequence in each series. This option is false if it is omitted. |
|
color1 Optional |
The color string of the first point series. The value is "#969696" if it is omitted. |
|
color2 Optional |
The color string of the second point series. The value is "#CB0000" if it is omitted. |
|
dash Optional |
If this option is true, the line is a dashed line; otherwise, the line is a full line. This option is false if it is omitted. |
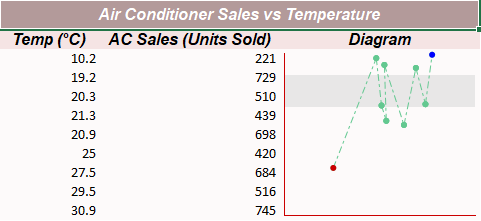
Consider a scenario where an electronic megastore wants to analyze the relationship between the sales of air conditioning units and the average temperature in a given week. A scatter sparkline can showcase the correlation between both of these sets of values.
| C# |
Copy Code
|
|---|---|
// Get sheet var worksheet = fpSpread1_Sheet1.AsWorksheet(); // Set data for sparkline worksheet.SetValue(1, 0, new object[,] { { "Temp (°C)","AC Sales (Units Sold)" , "Diagram"}, { 10.2,221, "null"}, { 19.2,729,"null"}, { 20.3,510,"null"}, { 21.3,439,"null"}, { 20.9,698,"null"}, { 25,420,"null"}, { 27.5,684,"null"}, { 29.5,516,"null"}, { 30.9,745,"null"} }); // Merge cells of column C worksheet.Cells["C3:C11"].Merge(); // Apply formula for ScatterSparkline worksheet.Cells[2, 2].Formula = "SCATTERSPARKLINE(A3:B11,,0,40,0,750,0,0,0,40,500,650,TRUE,TRUE,TRUE,\"#63C890\",,TRUE)"; |
|
| Visual Basic |
Copy Code
|
|---|---|
'Get sheet Dim worksheet = FpSpread1_Sheet1.AsWorksheet() 'Set data for sparkline worksheet.SetValue(1, 0, New Object(,) { {"Temp (°C)", "AC Sales (Units Sold)", "Diagram"}, {10.2, 221, "null"}, {19.2, 729, "null"}, {20.3, 510, "null"}, {21.3, 439, "null"}, {20.9, 698, "null"}, {25, 420, "null"}, {27.5, 684, "null"}, {29.5, 516, "null"}, {30.9, 745, "null"} }) 'Merge cells of column C worksheet.Cells("C3:C11").Merge() 'Apply formula for ScatterSparkline worksheet.Cells(2, 2).Formula = "SCATTERSPARKLINE(A3:B11,,0,40,0,750,0,0,0,40,500,650,TRUE,TRUE,TRUE,""#63C890"",,TRUE)" |
|

You can also set additional sparkline settings in the dialog if available.