Spread sparklines can be used to distribute data and compare them using different styles as shown in the image below.

When the sparkline is horizontal, the horizontal axis represents each point. The length of lines or the number of dots in the vertical axis represents the frequency of occurrence.
The spread sparkline formula has the following syntax:
=SPREADSPARKLINE(points, [showAverage, scaleStart, scaleEnd, style, colorScheme, vertical])
The formula options are described below where only 'points' is the default parameter:
| Option | Description |
| points | A reference that represents a range of cells that contains the values, such as "A1:A10". |
|
showAverage Optional |
A boolean that represents whether to show the average. The default value is false. |
|
scaleStart Optional |
A number that represents the minimum boundary of the sparkline. The default value is the minimum of all values. |
|
scaleEnd Optional |
A number that represents the maximum boundary of the sparkline. The default value is the maximum of all values. |
|
style Optional |
A number that references the style of the Spread sparkline. The following six styles are supported:
The default value is 4 (poles). |
|
colorScheme Optional |
A string that represents the color of the sparkline. The default value is "#646464". |
|
vertical Optional |
A boolean that represents whether to display the sparkline vertically. The default value is false. |
Consider a scenario where the disaster management department of a country wants to share the cost distribution and the fatalities suffered in different disasters that occurred through the years. A spread sparkline can help to display the various statistics involved with calamities, as shown in the image below.
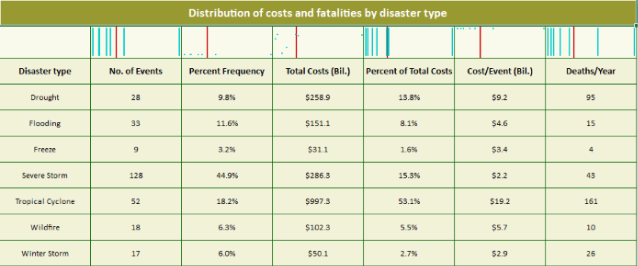
Spread Sparkline
| C# |
Copy Code
|
|---|---|
// Get sheet var worksheet = fpSpread1_Sheet1.AsWorksheet(); // Set data worksheet.SetValue(2, 0, new object[,] { { "Disaster type","No. of Events","Percent Frequency","Total Costs (Bil.)","Percent of Total Costs","Cost/Event (Bil.)","Deaths/Year" }, {"Drought",28, 0.098, 258.9,0.138,9.2, 95 }, {"Flooding",33, 0.116,151.09,0.081,4.6, 15}, {"Freeze",9,0.032,31.07,0.016,3.4,4}, {"Severe Storm",128,0.449, 286.3,0.153,2.2, 43}, {"Tropical Cyclone",52, 0.182,997.3,0.531,19.2,161}, {"Wildfire",18,0.063,102.3,0.055,5.7,10}, {"Winter Storm",17,0.060,50.1,0.027,2.9, 26} }); // Set SpreadSparkline formula worksheet.Cells["B2"].Formula = "SPREADSPARKLINE(B4:B10,TRUE,,,1,\"#00cccc\")"; worksheet.Cells["C2"].Formula = "SPREADSPARKLINE(C4:C10,TRUE,,,2,\"#00cccc\")"; worksheet.Cells["D2"].Formula = "SPREADSPARKLINE(D4:D10,TRUE,,,3,\"#00cccc\")"; worksheet.Cells["E2"].Formula = "SPREADSPARKLINE(E4:E10,TRUE,,,4,\"#00cccc\")"; worksheet.Cells["F2"].Formula = "SPREADSPARKLINE(F4:F10,TRUE,,,5,\"#00cccc\")"; worksheet.Cells["G2"].Formula = "SPREADSPARKLINE(G4:G10,TRUE,,,6,\"#00cccc\")"; |
|
| Visual Basic |
Copy Code
|
|---|---|
'Get sheet Dim worksheet = FpSpread1.Sheets(0).AsWorksheet() 'Set data worksheet.SetValue(2, 0, New Object(,) { {"Disaster type", "No. of Events", "Percent Frequency", "Total Costs (Bil.)", "Percent of Total Costs", "Cost/Event (Bil.)", "Deaths/Year"}, {"Drought", 28, 0.098, 258.9, 0.138, 9.2, 95}, {"Flooding", 33, 0.116, 151.09, 0.081, 4.6, 15}, {"Freeze", 9, 0.032, 31.07, 0.016, 3.4, 4}, {"Severe Storm", 128, 0.449, 286.3, 0.153, 2.2, 43}, {"Tropical Cyclone", 52, 0.182, 997.3, 0.531, 19.2, 161}, {"Wildfire", 18, 0.063, 102.3, 0.055, 5.7, 10}, {"Winter Storm", 17, 0.06, 50.1, 0.027, 2.9, 26} }) 'Set SpreadSparkline formula worksheet.Cells("B2").Formula = "SPREADSPARKLINE(B4:B10,TRUE,,,1,""#00cccc"")" worksheet.Cells("C2").Formula = "SPREADSPARKLINE(C4:C10,TRUE,,,2,""#00cccc"")" worksheet.Cells("D2").Formula = "SPREADSPARKLINE(D4:D10,TRUE,,,3,""#00cccc"")" worksheet.Cells("E2").Formula = "SPREADSPARKLINE(E4:E10,TRUE,,,4,""#00cccc"")" worksheet.Cells("F2").Formula = "SPREADSPARKLINE(F4:F10,TRUE,,,5,""#00cccc"")" worksheet.Cells("G2").Formula = "SPREADSPARKLINE(G4:G10,TRUE,,,6,""#00cccc"")" |
|

You can also set additional sparkline settings in the dialog if available.