You can set borders for most areas of the chart. See the LineBorder and PointBorder properties in the LineSeries class for more information. The XYBubbleSeries class has additional border settings such as NegativeBorder and PositiveBorder.
You can set shapes such as the bar shape. See the BarShape property for more information.
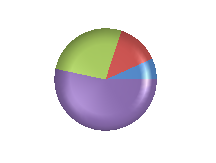
You can apply additional effects to the 3D chart control such as color, directional lighting, and positional lighting. Directional lighting mimics a distant light source such as rays from the sun (parallel paths). Positional lighting mimics a close light source such as a lamp where the light radiates out from a single point.
The following image displays a graph that uses light colors, direction, and position:
The following color effects are available:
You can specify the position and the direction of the light with the following properties:
The following example demonstrates using light colors, direction, and position.
| C# |
Copy Code
|
|---|---|
FarPoint.Win.Chart.PieSeries series = new FarPoint.Win.Chart.PieSeries(); series.SeriesName = "Series 1"; series.TopBevel = new FarPoint.Win.Chart.CircleBevel(12.0f, 12.0f); series.BottomBevel = new FarPoint.Win.Chart.CircleBevel(12.0f, 12.0f); series.Values.Add(1.0); series.Values.Add(2.0); series.Values.Add(4.0); series.Values.Add(8.0); FarPoint.Win.Chart.PiePlotArea plotArea = new FarPoint.Win.Chart.PiePlotArea(); plotArea.Location = new PointF(0.2f, 0.2f); plotArea.Size = new SizeF(0.6f, 0.6f); plotArea.Series.Add(series); FarPoint.Win.Chart.PositionalLight light0 = new FarPoint.Win.Chart.PositionalLight(); light0.AmbientColor = Color.FromArgb(64, 64, 64); light0.DiffuseColor = Color.FromArgb(64, 64, 64); light0.SpecularColor = Color.FromArgb(128, 128, 128); light0.PositionX = 0.0f; light0.PositionY = 0.0f; light0.PositionZ = 100.0f; FarPoint.Win.Chart.DirectionalLight light1 = new FarPoint.Win.Chart.DirectionalLight(); light1.AmbientColor = Color.FromArgb(64, 64, 64); light1.DiffuseColor = Color.FromArgb(64, 64, 64); light1.SpecularColor = Color.FromArgb(128, 128, 128); light1.DirectionX = 1.0f; light1.DirectionY = 0.0f; light1.DirectionZ = 1.0f; FarPoint.Win.Chart.ChartModel model = new FarPoint.Win.Chart.ChartModel(); model.PlotAreas.Add(plotArea); model.PlotAreas[0].Lights.Clear(); model.PlotAreas[0].Lights.Add(light0); model.PlotAreas[0].Lights.Add(light1); fpChart1.Model = model; |
|
| VB |
Copy Code
|
|---|---|
Dim series As New FarPoint.Win.Chart.PieSeries() series.SeriesName = "Series 1" series.TopBevel = New FarPoint.Win.Chart.CircleBevel(12.0F, 12.0F) series.BottomBevel = New FarPoint.Win.Chart.CircleBevel(12.0F, 12.0F) series.Values.Add(1.0) series.Values.Add(2.0) series.Values.Add(4.0) series.Values.Add(8.0) Dim plotArea As New FarPoint.Win.Chart.PiePlotArea() plotArea.Location = New PointF(0.2F, 0.2F) plotArea.Size = New SizeF(0.6F, 0.6F) plotArea.Series.Add(series) Dim light0 As New FarPoint.Win.Chart.PositionalLight() light0.AmbientColor = Color.FromArgb(64, 64, 64) light0.DiffuseColor = Color.FromArgb(64, 64, 64) light0.SpecularColor = Color.FromArgb(128, 128, 128) light0.PositionX = 0.0F light0.PositionY = 0.0F light0.PositionZ = 100.0F Dim light1 As New FarPoint.Win.Chart.DirectionalLight() light1.AmbientColor = Color.FromArgb(64, 64, 64) light1.DiffuseColor = Color.FromArgb(64, 64, 64) light1.SpecularColor = Color.FromArgb(128, 128, 128) light1.DirectionX = 1.0F light1.DirectionY = 0.0F light1.DirectionZ = 1.0F Dim model As New FarPoint.Win.Chart.ChartModel() model.PlotAreas.Add(plotArea) model.PlotAreas(0).Lights.Clear() model.PlotAreas(0).Lights.Add(light0) model.PlotAreas(0).Lights.Add(light1) fpChart1.Model = model |
|