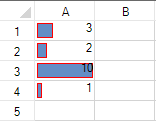
The data bar rule uses a bar that is displayed as the background for each cell. The length of the bar corresponds to the size of the data relative to the other data in the worksheet. The longer the bar, the greater the value in the cell.
The following image displays data bars in a cell range:
You can specify the value type and the value to compare in the conditional format.
| Value Type | Description |
|---|---|
| Percent | The minimum value in the range of cells that the conditional formatting rule applies to plus x percent of the difference between the maximum and minimum values in the range of cells that the conditional formatting rule applies to. For example, if the minimum and maximum values in the range are 1 and 10 respectively, and x is 10, then the value is 1.9. |
| Highest Value | The maximum value in the range of cells that the conditional formatting rule applies to. |
| Lowest Value | The minimum value in the range of cells that the conditional formatting rule applies to. |
| Formula | The result of the formula determines the minimum or maximum value of the cell range that the rule applies to. If the result is not numeric, it is treated as zero. |
| Percentile | The result of the function percentile applied to the range with x. |
| Automatic | The smaller or larger or the minimum or maximum value in the range of cells that the conditional format applies to. |
| Number | Number, date, or time value in the range of cells that the conditional formatting rule applies to. |
Valid percentiles are from 0 (zero) to 100. A percentile cannot be used if the range of cells contains more than 8,191 data points.
Use a percentile when you want to visualize a group of high values (such as the top 20th percentile) in one data bar and low values (such as the bottom 20th percentile) in another data bar. This is useful if you have extreme values that might skew the visualization of your data.
Valid percent values are from 0 (zero) to 100. Percent values should not use a percent sign. Use a percentage when you want to visualize all values proportionally because the distribution of values is proportional.
Start formulas with an equal sign (=). Invalid formulas result in no formatting applied.
The minimum and maximum types can be different. The Maximum property should not be set to a ConditionalFormattingValue value such as ConditionalFormattingValueType.Min or ConditionalFormattingValueType.AutoMin. An exception will occur in this case. The Minimum property should not be set to a ConditionalFormattingValue value such as ConditionalFormattingValueType.Max or ConditionalFormattingValueType.AutoMax. An exception will occur in this case.
You can also specify borders, colors, and an axis.
Set the properties of the data bar rule class and then apply the formatting.
This example code creates a data bar rule and uses the SetConditionalFormatting method to apply the rule.
| C# |
Copy Code
|
|---|---|
private void Form1_Load(object sender, EventArgs e) { fpSpread1.Sheets[0].Cells[0, 0].Value = 3; fpSpread1.Sheets[0].Cells[1, 0].Value = 2; fpSpread1.Sheets[0].Cells[2, 0].Value = 10; fpSpread1.Sheets[0].Cells[3, 0].Value = 1; } private void button1_Click(object sender, EventArgs e) { FarPoint.Win.Spread.DatabarConditionalFormattingRule d = new FarPoint.Win.Spread.DatabarConditionalFormattingRule(); d.BorderColor = Color.Red; d.ShowBorder = true; d.Minimum = new FarPoint.Win.Spread.ConditionalFormattingValue(0, FarPoint.Win.Spread.ConditionalFormattingValueType.Number); d.Maximum = new FarPoint.Win.Spread.ConditionalFormattingValue(15, FarPoint.Win.Spread.ConditionalFormattingValueType.Max); fpSpread1.ActiveSheet.SetConditionalFormatting(0, 0, 4, 1, d); } |
|
| VB |
Copy Code
|
|---|---|
Private Sub Form1_Load(ByVal sender As System.Object, ByVal e As System.EventArgs) Handles MyBase.Load
        fpSpread1.Sheets(0).Cells(0, 0).Value = 3
        fpSpread1.Sheets(0).Cells(1, 0).Value = 2
        fpSpread1.Sheets(0).Cells(2, 0).Value = 10
        fpSpread1.Sheets(0).Cells(3, 0).Value = 1
    End Sub

    Private Sub Button1_Click(ByVal sender As System.Object, ByVal e As System.EventArgs) Handles Button1.Click
        Dim d As New FarPoint.Win.Spread.DatabarConditionalFormattingRule()
        d.BorderColor = Color.Red
        d.ShowBorder = True
        d.Minimum = New FarPoint.Win.Spread.ConditionalFormattingValue(0, FarPoint.Win.Spread.ConditionalFormattingValueType.Number)
        d.Maximum = New FarPoint.Win.Spread.ConditionalFormattingValue(15, FarPoint.Win.Spread.ConditionalFormattingValueType.Max)
        fpSpread1.ActiveSheet.SetConditionalFormatting(0, 0, 4, 1, d)
    End Sub
|
|