In This Topic
A pareto chart contains both bars and a line graph. Individual values are represented in descending order by bars and the cumulative total is represented by a line. The pareto chart is used to highlight the most important items in a set of values.
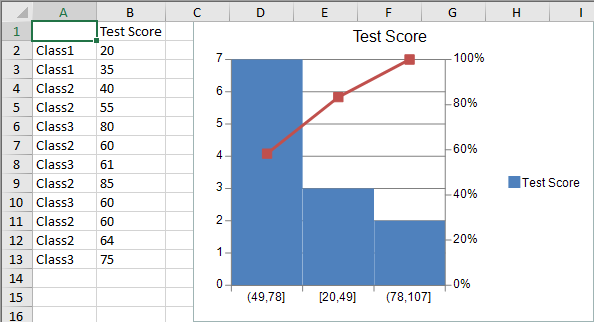
You can use the ParetoSeries class and the YPlotArea class to create a pareto chart.
For information about creating charts in the Spread Designer or the Chart Designer, refer to Using the Chart Control on sheet or Adding a Chart Control.
Using Code
- Add data for the chart with the ParetoSeries class.
- Specify the plot area using the YPlotArea class.
- Set the position and size of the plot area.
- Add a series to the plot area.
- Create a chart model and add the plot area to this model.
- Create a chart and set a chart model for this chart.
- Add the chart to SPREAD.
Example
This example creates a pareto chart.
| C# |
Copy Code
|
fpSpread1.ActiveSheet.Cells[0, 1].Text = "Test Score";
fpSpread1.ActiveSheet.SetClipValue(1, 0, 13, 1, "Class1\r\nClass1\r\nClass2\r\nClass2\r\nClass3\r\nClass2\r\nClass3\r\nClass2\r\nClass3\r\nClass2\r\nClass2\r\nClass3");
fpSpread1.ActiveSheet.SetClipValue(1, 1, 13, 1, "20\r\n35\r\n40\r\n55\r\n80\r\n60\r\n61\r\n85\r\n60\r\n60\r\n64\r\n75");
fpSpread1.ActiveSheet.AddChart(new FarPoint.Win.Spread.Model.CellRange(0, 0, 13, 2), typeof(FarPoint.Win.Chart.ParetoSeries), 400, 300, 150, 30);

// Set YPlotArea
YPlotArea YPlotArea = (YPlotArea)fpSpread1.ActiveSheet.Charts[0].Model.PlotAreas[0];
ParetoSeries hisSeries = (ParetoSeries)YPlotArea.Series[0];
hisSeries.ParetoLine.PointMarker = new BuiltinMarker(MarkerShape.Square, 7.0f);
hisSeries.BinOption.BinType = FarPoint.Win.Chart.BinOption.HistogramBinType.Automatic;
|
| VB |
Copy Code
|
FpSpread1.ActiveSheet.Cells(0, 1).Text = "Test Score"
FpSpread1.ActiveSheet.SetClipValue(1, 0, 13, 1, "Class1" & vbCrLf & "Class1" & vbCrLf & "Class2" & vbCrLf & "Class2" & vbCrLf & "Class3" & vbCrLf & "Class2" & vbCrLf & "Class3" & vbCrLf & "Class2" & vbCrLf & "Class3" & vbCrLf & "Class2" & vbCrLf & "Class2" & vbCrLf & "Class3")
FpSpread1.ActiveSheet.SetClipValue(1, 1, 13, 1, "20" & vbCrLf & "35" & vbCrLf & "40" & vbCrLf & "55" & vbCrLf & "80" & vbCrLf & "60" & vbCrLf & "61" & vbCrLf & "85" & vbCrLf & "60" & vbCrLf & "60" & vbCrLf & "64" & vbCrLf & "75")
FpSpread1.ActiveSheet.AddChart(New FarPoint.Win.Spread.Model.CellRange(0, 0, 13, 2), GetType(FarPoint.Win.Chart.ParetoSeries), 400, 300, 150, 30)

// Set YPlotArea
Dim YPlotArea As YPlotArea = CType(FpSpread1.ActiveSheet.Charts(0).Model.PlotAreas(0), YPlotArea)
Dim hisSeries As ParetoSeries = CType(YPlotArea.Series(0), ParetoSeries)
hisSeries.ParetoLine.PointMarker = New BuiltinMarker(MarkerShape.Square, 7.0F)
hisSeries.BinOption.BinType = FarPoint.Win.Chart.BinOption.HistogramBinType.Automatic
|