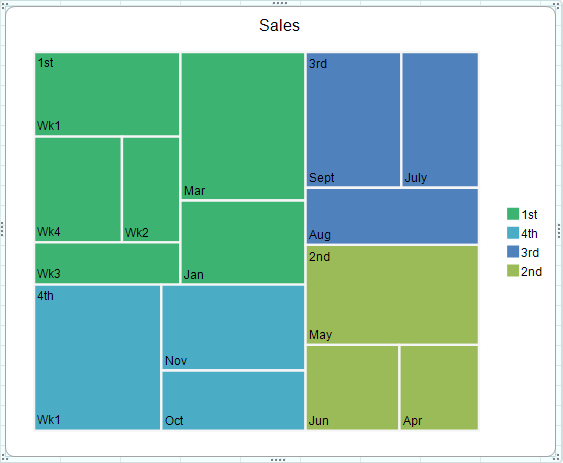
A treemap chart displays hierarchical data as a set of nested rectangles. The tree branches are represented by rectangles and each sub-branch is shown as a smaller rectangle. The rectangles in the chart use color and size to make it easier to spot patterns. Treemap charts also make efficient use of space and are useful for displaying large amounts of data.
You can use the TreemapSeries class and the TreemapPlotArea class to create a treemap chart.
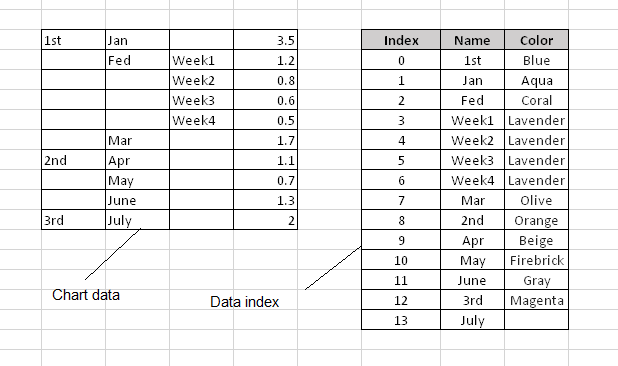
You can set a color for each item in the treemap chart using the Fills property. Colors are mapped to the items based on the index order. The following image and code example show how the colors would be mapped to each data item.
| C# |
Copy Code
|
|---|---|
|
FarPoint.Win.Chart.TreemapSeries series = new FarPoint.Win.Chart.TreemapSeries(); FarPoint.Win.Chart.StringCollectionItem collection1 = new FarPoint.Win.Chart.StringCollectionItem(); |
|
For information about creating charts in the Spread Designer or the Chart Designer, refer to Using the Chart Control on sheet or Adding Charts.
This example creates a treemap chart.
| C# |
Copy Code
|
|---|---|
| fpSpread1.ActiveSheet.Cells[0, 0].Text = "Quarter"; fpSpread1.ActiveSheet.Cells[0, 1].Text = "Month"; fpSpread1.ActiveSheet.Cells[0, 2].Text = "Week"; fpSpread1.ActiveSheet.Cells[0, 3].Text = "Sales"; fpSpread1.ActiveSheet.Cells[1, 0].Text = "1st"; fpSpread1.ActiveSheet.Cells[1, 1].Text = "Jan"; fpSpread1.ActiveSheet.Cells[1, 3].Value = 1.7; fpSpread1.ActiveSheet.Cells[2, 1].Text = "Feb"; fpSpread1.ActiveSheet.Cells[2, 2].Text = "Wk1"; fpSpread1.ActiveSheet.Cells[2, 3].Value = 2.0; fpSpread1.ActiveSheet.Cells[3, 2].Text = "Wk2"; fpSpread1.ActiveSheet.Cells[3, 3].Value = 1.0; fpSpread1.ActiveSheet.Cells[4, 2].Text = "Wk3"; fpSpread1.ActiveSheet.Cells[4, 3].Value = 1.0; fpSpread1.ActiveSheet.Cells[5, 2].Text = "Wk4"; fpSpread1.ActiveSheet.Cells[5, 3].Value = 1.5; fpSpread1.ActiveSheet.Cells[6, 1].Text = "Mar"; fpSpread1.ActiveSheet.Cells[6, 3].Value = 3.0; fpSpread1.ActiveSheet.Cells[7, 0].Text = "2nd"; fpSpread1.ActiveSheet.Cells[7, 1].Text = "Apr"; fpSpread1.ActiveSheet.Cells[7, 3].Value = 1.1; fpSpread1.ActiveSheet.Cells[8, 1].Text = "May"; fpSpread1.ActiveSheet.Cells[8, 3].Value = 2.8; fpSpread1.ActiveSheet.Cells[9, 1].Text = "Jun"; fpSpread1.ActiveSheet.Cells[9, 3].Value = 1.3; fpSpread1.ActiveSheet.Cells[10, 0].Text = "3rd"; fpSpread1.ActiveSheet.Cells[10, 1].Text = "July"; fpSpread1.ActiveSheet.Cells[10, 3].Value = 1.7; fpSpread1.ActiveSheet.Cells[11, 1].Text = "Aug"; fpSpread1.ActiveSheet.Cells[11, 3].Value = 1.6; fpSpread1.ActiveSheet.Cells[12, 1].Text = "Sept"; fpSpread1.ActiveSheet.Cells[12, 3].Value = 2.1; fpSpread1.ActiveSheet.Cells[13, 0].Text = "4th"; fpSpread1.ActiveSheet.Cells[13, 1].Text = "Oct"; fpSpread1.ActiveSheet.Cells[13, 3].Value = 1.4; fpSpread1.ActiveSheet.Cells[14, 1].Text = "Nov"; fpSpread1.ActiveSheet.Cells[14, 3].Value = 2.0; fpSpread1.ActiveSheet.Cells[15, 1].Text = "Dec"; fpSpread1.ActiveSheet.Cells[15, 2].Text = "Wk1"; fpSpread1.ActiveSheet.Cells[15, 3].Value = 3.0; fpSpread1.ActiveSheet.AddChart(new FarPoint.Win.Spread.Model.CellRange(0, 0, 16, 4), typeof(FarPoint.Win.Chart.TreemapSeries), 550, 450, 300, 0); FarPoint.Win.Chart.TreemapSeries treeseries = (FarPoint.Win.Chart.TreemapSeries)fpSpread1.Sheets[0].Charts[0].Model.PlotAreas[0].Series[0]; treeseries.Fills.AddRange(new FarPoint.Win.Chart.Fill[] { new FarPoint.Win.Chart.SolidFill(Color.MediumSeaGreen), null, null, null, null }); |
|
| VB |
Copy Code
|
|---|---|
| fpSpread1.ActiveSheet.Cells(0, 0).Text = "Quarter" fpSpread1.ActiveSheet.Cells(0, 1).Text = "Month" fpSpread1.ActiveSheet.Cells(0, 2).Text = "Week" fpSpread1.ActiveSheet.Cells(0, 3).Text = "Sales" fpSpread1.ActiveSheet.Cells(1, 0).Text = "1st" fpSpread1.ActiveSheet.Cells(1, 1).Text = "Jan" fpSpread1.ActiveSheet.Cells(1, 3).Value = 1.7 fpSpread1.ActiveSheet.Cells(2, 1).Text = "Feb" fpSpread1.ActiveSheet.Cells(2, 2).Text = "Wk1" fpSpread1.ActiveSheet.Cells(2, 3).Value = 2.0 fpSpread1.ActiveSheet.Cells(3, 2).Text = "Wk2" fpSpread1.ActiveSheet.Cells(3, 3).Value = 1.0 fpSpread1.ActiveSheet.Cells(4, 2).Text = "Wk3" fpSpread1.ActiveSheet.Cells(4, 3).Value = 1.0 fpSpread1.ActiveSheet.Cells(5, 2).Text = "Wk4" fpSpread1.ActiveSheet.Cells(5, 3).Value = 1.5 fpSpread1.ActiveSheet.Cells(6, 1).Text = "Mar" fpSpread1.ActiveSheet.Cells(6, 3).Value = 3.0 fSpread1.ActiveSheet.Cells(7, 0).Text = "2nd" fpSpread1.ActiveSheet.Cells(7, 1).Text = "Apr" fpSpread1.ActiveSheet.Cells(7, 3).Value = 1.1 fpSpread1.ActiveSheet.Cells(8, 1).Text = "May" fpSpread1.ActiveSheet.Cells(8, 3).Value = 2.8 fpSpread1.ActiveSheet.Cells(9, 1).Text = "Jun" fpSpread1.ActiveSheet.Cells(9, 3).Value = 1.3 fpSpread1.ActiveSheet.Cells(10, 0).Text = "3rd" fpSpread1.ActiveSheet.Cells(10, 1).Text = "July" fpSpread1.ActiveSheet.Cells(10, 3).Value = 1.7 fpSpread1.ActiveSheet.Cells(11, 1).Text = "Aug" fpSpread1.ActiveSheet.Cells(11, 3).Value = 1.6 fpSpread1.ActiveSheet.Cells(12, 1).Text = "Sept" fpSpread1.ActiveSheet.Cells(12, 3).Value = 2.1 fpSpread1.ActiveSheet.Cells(13, 0).Text = "4th" fpSpread1.ActiveSheet.Cells(13, 1).Text = "Oct" fpSpread1.ActiveSheet.Cells(13, 3).Value = 1.4 fpSpread1.ActiveSheet.Cells(14, 1).Text = "Nov" fpSpread1.ActiveSheet.Cells(14, 3).Value = 2.0 fpSpread1.ActiveSheet.Cells(15, 1).Text = "Dec" fpSpread1.ActiveSheet.Cells(15, 2).Text = "Wk1" fpSpread1.ActiveSheet.Cells(15, 3).Value = 3.0 fpSpread1.ActiveSheet.AddChart(New FarPoint.Win.Spread.Model.CellRange(0, 0, 16, 4), GetType(FarPoint.Win.Chart.TreemapSeries), 550, 450, 300, 0) Dim treeseries As FarPoint.Win.Chart.TreemapSeries = DirectCast(fpSpread1.Sheets(0).Charts(0).Model.PlotAreas(0).Series(0), FarPoint.Win.Chart.TreemapSeries) treeseries.Fills.AddRange(New FarPoint.Win.Chart.Fill() {New FarPoint.Win.Chart.SolidFill(Color.MediumSeaGreen), Nothing, Nothing, Nothing, Nothing}) |
|