You can allow the users to resize, move, or change the range of elements displayed by the chart. The user can also select elements on the chart and the related cell range in the Spread control will be selected.
The user can make the following changes at run time.
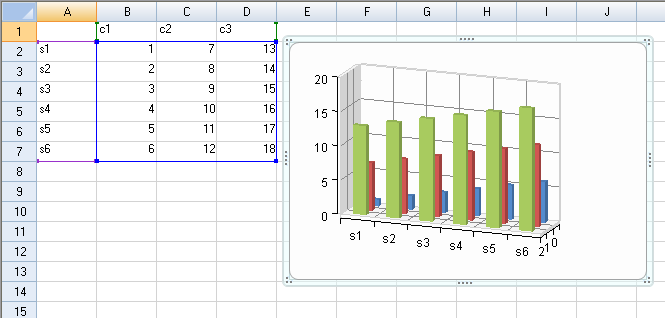
The following image shows a selected range of data used by the chart. Put the mouse pointer over the blue square to get resize arrows.
You can use the CanMove property to prevent the user from moving and CanSize property to resize the chart. The Locked property prevents the user from moving and resizing the chart control.
This example sets the Locked, CanMove, and CanResize properties.
| C# |
Copy Code
|
|---|---|
FarPoint.Win.Spread.Chart.SpreadChart chart; chart = fpSpread1.Sheets[0].AddChart(0, 0, typeof(FarPoint.Win.Chart.BarSeries), 400, 400, 200, 80, FarPoint.Win.Chart.ChartViewType.View2D, true); chart.Locked = true; //chart.CanSize = FarPoint.Win.Spread.DrawingSpace.Sizing.None; //chart.CanMove = FarPoint.Win.Spread.DrawingSpace.Moving.Horizontal; |
|
| VB |
Copy Code
|
|---|---|
Dim chart As FarPoint.Win.Spread.Chart.SpreadChart Dim range As New FarPoint.Win.Spread.Model.CellRange(0, 0, 7, 4) chart = fpSpread1.Sheets(0).AddChart(range, GetType(FarPoint.Win.Chart.BarSeries), 400, 300, 300, 80, FarPoint.Win.Chart.ChartViewType.View3D, False) chart.Locked = True 'chart.CanSize = FarPoint.Win.Spread.DrawingSpace.Sizing.None 'chart.CanMove = FarPoint.Win.Spread.DrawingSpace.Moving.Horizontal |
|