You can add a standard column, line, or winloss sparkline to a cell using the AddSparkline method. As shown in the following figure, these sparklines were created using a minimum axis of -8 and a maximum axis of 15.
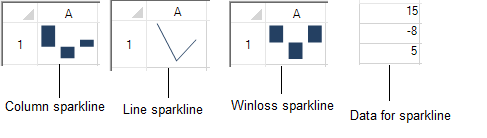
The column sparkline draws the values as a column chart. The line sparkline draws the values as a line chart. The winloss sparkline shows the points with the same size. Negative points extend down from the axis and positive points extend up.
These sparklines can be enhanced by adding other styles and technical properties such as displaying negative points or colors for the marker points as well as colors for high, low, negative, first, and last points. You can set all these using the ExcelSparklineSetting class.
This example creates a column sparkline in a cell and shows negative and series colors.
| C# |
Copy Code
|
|---|---|
FarPoint.Win.Spread.SheetView sv = new FarPoint.Win.Spread.SheetView(); FarPoint.Win.Spread.Chart.SheetCellRange data = new FarPoint.Win.Spread.Chart.SheetCellRange(sv, 0,0,1, 5); FarPoint.Win.Spread.Chart.SheetCellRange data2 = new FarPoint.Win.Spread.Chart.SheetCellRange(sv, 5,0,1,1); FarPoint.Win.Spread.ExcelSparklineSetting ex = new FarPoint.Win.Spread.ExcelSparklineSetting(); ex.ShowMarkers = true; ex.ShowNegative = true; ex.NegativeColor = Color.Red; // Use with a Column or Winloss type ex.SeriesColor = Color.Olive; fpSpread1.Sheets[0] = sv; sv.Cells[0, 0].Value = 2; sv.Cells[0, 1].Value = 5; sv.Cells[0, 2].Value = 4; sv.Cells[0, 3].Value = -1; sv.Cells[0, 4].Value = 3; fpSpread1.Sheets[0].AddSparkline(data, data2, FarPoint.Win.Spread.SparklineType.Column, ex); |
|
| VB |
Copy Code
|
|---|---|
Dim sv As New FarPoint.Win.Spread.SheetView() Dim data As New FarPoint.Win.Spread.Chart.SheetCellRange(sv, 0, 0, 1, 5) Dim data2 As New FarPoint.Win.Spread.Chart.SheetCellRange(sv, 5, 0, 1, 1) Dim ex As New FarPoint.Win.Spread.ExcelSparklineSetting() ex.ShowMarkers = True ex.ShowNegative = True ex.NegativeColor = Color.Red ' Use with a Column or Winloss type ex.SeriesColor = Color.Olive fpSpread1.Sheets(0) = sv sv.Cells(0, 0).Value = 2 sv.Cells(0, 1).Value = 5 sv.Cells(0, 2).Value = 4 sv.Cells(0, 3).Value = -1 sv.Cells(0, 4).Value = 3 fpSpread1.Sheets(0).AddSparkline(data, data2, FarPoint.Win.Spread.SparklineType.Column, ex) |
|
For more information, see the following topics: