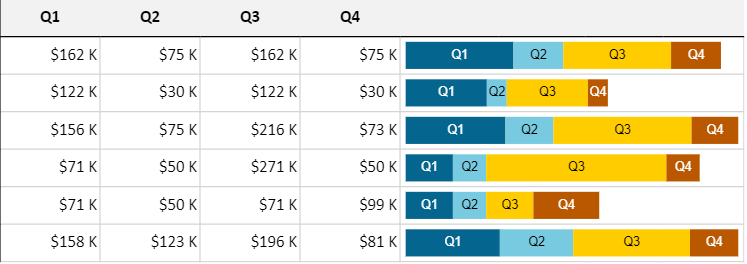
A stacked sparkline is used to show a sliced breakdown of a value in different categories. It is useful for comparing values across categories as shown in the image below.
The stacked sparkline formula has the following syntax:
=STACKEDSPARKLINE(points, [colorRange, labelRange, maximum, targetRed, targetGreen, targetBlue, tragetYellow, color, highlightPosition, vertical, textOrientation, textSize, minimum])
The formula options are described below:
| Option | Description |
| points | A reference that represents a range of cells that contains the values, such as "A1:A4". |
|
colorRange Optional |
A reference that represents a range of cells that contains all colors, such as "B1:B4". The default value is generated by color. |
|
labelRange Optional |
A reference that represents a cell range that contains all labels, such as "C1:C4". The default value is empty. |
|
maximum Optional |
A number that represents the maximum value of the sparkline. The default value is the summary of all positive values. |
|
targetRed Optional |
A number that represents the location of the red line. This setting is optional. The default value is empty. |
|
targetGreen Optional |
A number that represents the location of the green line. The default value is empty. |
|
targetBlue Optional |
A number that represents the location of the blue line. The default value is empty. |
|
targetYellow Optional |
A number that represents the location of the yellow line. The default value is empty. |
|
color Optional |
A string that represents the color if colorRange is omitted. The default value is "#646464". |
|
highlightPosition Optional |
A number that represents the index of the highlight area. The default value is empty. |
|
vertical Optional |
A boolean that represents whether to display the sparkline vertically. The default value is false. |
|
textOrientation Optional |
A number that represents the label text orientation. The default value is 0 (horizontal). The vertical setting is 1. |
|
textSize Optional |
A number that represents the size of the label text in pixels. The default value is 10. |
|
minimum Optional |
A number that represents the minimum axis value. The default value is 0. |
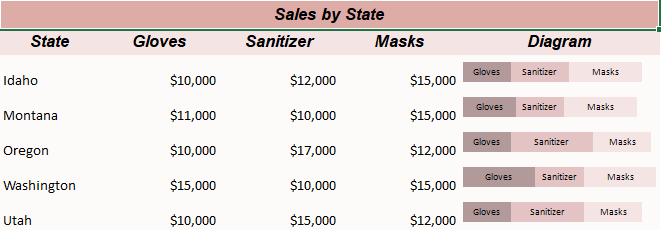
Consider a scenario where a company wants to display the sales of products in different US states. Stacked sparklines can show each US state divided into the shares of the company products.
| C# |
Copy Code
|
|---|---|
// Get sheet var worksheet = fpSpread1_Sheet1.AsWorksheet(); // Add data for sparkline worksheet.SetValue(1, 0, "State"); worksheet.SetValue(1, 1, "Gloves"); worksheet.SetValue(1, 2, "Sanitizer"); worksheet.SetValue(1, 3, "Masks"); worksheet.SetValue(1, 4, "Diagram"); worksheet.SetValue(2, 0, "Idaho"); worksheet.SetValue(2, 1, 10000); worksheet.SetValue(2, 2, 12000); worksheet.SetValue(2, 3, 15000); worksheet.SetValue(3, 0, "Montana"); worksheet.SetValue(3, 1, 11000); worksheet.SetValue(3, 2, 10000); worksheet.SetValue(3, 3, 15000); worksheet.SetValue(4, 0, "Oregon"); worksheet.SetValue(4, 1, 10000); worksheet.SetValue(4, 2, 17000); worksheet.SetValue(4, 3, 12000); worksheet.SetValue(5, 0, "Washington"); worksheet.SetValue(5, 1, 15000); worksheet.SetValue(5, 2, 10000); worksheet.SetValue(5, 3, 15000); worksheet.SetValue(6, 0, "Utah"); worksheet.SetValue(6, 1, 10000); worksheet.SetValue(6, 2, 15000); worksheet.SetValue(6, 3, 12000); worksheet.SetValue(7, 1, "#B39A9A"); worksheet.SetValue(7, 2, "#E3C3C3"); worksheet.SetValue(7, 3, "#F5E4E4"); // Set number format for columns worksheet.Columns["B:D"].NumberFormat = "$#,##0"; // Set StackedSparkline formula worksheet.Cells[2, 4].Formula = "STACKEDSPARKLINE(B3:D3,B8:D8,B2:D2,40000)"; worksheet.Cells[3, 4].Formula = "STACKEDSPARKLINE(B4:D4,B8:D8,B2:D2,40000)"; worksheet.Cells[4, 4].Formula = "STACKEDSPARKLINE(B5:D5,B8:D8,B2:D2,40000)"; worksheet.Cells[5, 4].Formula = "STACKEDSPARKLINE(B6:D6,B8:D8,B2:D2,40000)"; worksheet.Cells[6, 4].Formula = "STACKEDSPARKLINE(B7:D7,B8:D8,B2:D2,40000)"; // Set backcolor for cells worksheet.Cells["A1"].Interior.Color = GrapeCity.Spreadsheet.Color.FromArgb(unchecked((int)0xFFDEACA7)); worksheet.Cells["A2:E2"].Interior.Color = GrapeCity.Spreadsheet.Color.FromArgb(unchecked((int)0xFFF5E4E4)); worksheet.Cells["A3:E7"].Interior.Color = GrapeCity.Spreadsheet.Color.FromArgb(unchecked((int)0xFFfdfafa)); |
|
| Visual Basic |
Copy Code
|
|---|---|
'Get sheet Dim worksheet = FpSpread1_Sheet1.AsWorksheet() 'Add data for sparkline worksheet.SetValue(1, 0, "State") worksheet.SetValue(1, 1, "Gloves") worksheet.SetValue(1, 2, "Sanitizer") worksheet.SetValue(1, 3, "Masks") worksheet.SetValue(1, 4, "Diagram") worksheet.SetValue(2, 0, "Idaho") worksheet.SetValue(2, 1, 10000) worksheet.SetValue(2, 2, 12000) worksheet.SetValue(2, 3, 15000) worksheet.SetValue(3, 0, "Montana") worksheet.SetValue(3, 1, 11000) worksheet.SetValue(3, 2, 10000) worksheet.SetValue(3, 3, 15000) worksheet.SetValue(4, 0, "Oregon") worksheet.SetValue(4, 1, 10000) worksheet.SetValue(4, 2, 17000) worksheet.SetValue(4, 3, 12000) worksheet.SetValue(5, 0, "Washington") worksheet.SetValue(5, 1, 15000) worksheet.SetValue(5, 2, 10000) worksheet.SetValue(5, 3, 15000) worksheet.SetValue(6, 0, "Utah") worksheet.SetValue(6, 1, 10000) worksheet.SetValue(6, 2, 15000) worksheet.SetValue(6, 3, 12000) worksheet.SetValue(7, 1, "#B39A9A") worksheet.SetValue(7, 2, "#E3C3C3") worksheet.SetValue(7, 3, "#F5E4E4") 'Set number format for columns worksheet.Columns("B:D").NumberFormat = "$#,##0" 'Set StackedSparkline formula worksheet.Cells(2, 4).Formula = "STACKEDSPARKLINE(B3:D3,B8:D8,B2:D2,40000)" worksheet.Cells(3, 4).Formula = "STACKEDSPARKLINE(B4:D4,B8:D8,B2:D2,40000)" worksheet.Cells(4, 4).Formula = "STACKEDSPARKLINE(B5:D5,B8:D8,B2:D2,40000)" worksheet.Cells(5, 4).Formula = "STACKEDSPARKLINE(B6:D6,B8:D8,B2:D2,40000)" worksheet.Cells(6, 4).Formula = "STACKEDSPARKLINE(B7:D7,B8:D8,B2:D2,40000)" 'Set back color for cells worksheet.Cells("A1").Interior.Color = GrapeCity.Spreadsheet.Color.FromArgb(&HFFDEACA7) worksheet.Cells("A2:E2").Interior.Color = GrapeCity.Spreadsheet.Color.FromArgb(&HFFF5E4E4) worksheet.Cells("A3:E7").Interior.Color = GrapeCity.Spreadsheet.Color.FromArgb(&HFFFDFAFA) |
|

You can also set additional sparkline settings in the dialog if available.