Vari sparklines are used to compare two sets of data and calculate the difference, or variance, between the values.
The vari sparkline formula has the following syntax:
=VARISPARKLINE(variance, [reference, mini, maxi, mark, tickunit, legend, colorPositive, colorNegative, vertical])
The formula options are described below:
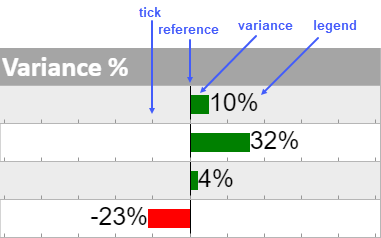
| Option | Description |
| variance | A number or reference that represents the bar length, such as 2 or "A1". |
|
reference Optional |
A number or reference that represents the location of the reference line, such as 0 or "A2". The default value is 0. |
|
mini Optional |
A number or reference that represents the minimum value of the sparkline, such as -5 or "A3". The default value is -1. |
|
maxi Optional |
A number or reference that represents the maximum value of the sparkline, such as 5 or "A4". The default value is 1. |
|
mark Optional |
A number or reference that represents the position of the mark line, such as 3 or "A5". |
|
tickunit Optional |
A number or reference that represents a tick unit, such as 1 or "A6". The default value is 0. |
|
legend Optional |
A boolean that represents whether to display the text. The default is optional. The default value is FALSE. |
|
colorPositive Optional |
A string that represents the color scheme for variance and is larger than reference. The default value is "green". |
|
colorNegative Optional |
A string that represents the color scheme for variance and is smaller than reference. The default value is "red". |
|
vertical Optional |
A boolean that represents whether to display the sparkline vertically. The default value is FALSE. |
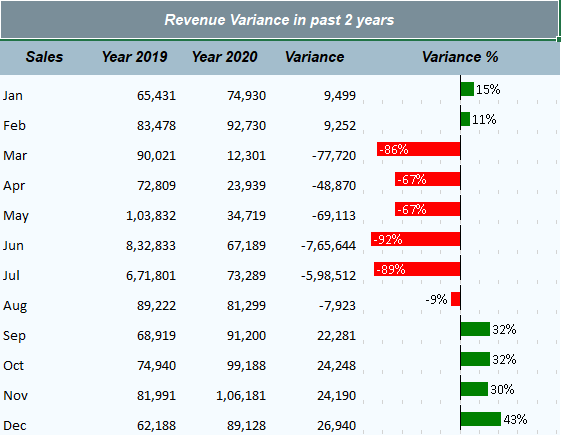
Consider a scenario where a company wants to display the revenue variation between two years, for example, in 2019 and 2020. A vari sparkline helps create a graphical representation of the data. It compares the revenue differences and presents the variance as shown in the image below.
| C# |
Copy Code
|
|---|---|
// Get sheet var worksheet = fpSpread1_Sheet1.AsWorksheet(); // Set data worksheet.SetValue(1, 0, new object[,] { {"Sales","Year 2019","Year 2020","Variance","Variance %" }, {"Jan",65431,74930,null,null}, {"Feb",83478,92730,null,null}, {"Mar",90021,12301,null,null}, {"Apr",72809,23939,null,null}, {"May",103832,34719,null,null}, {"Jun",832833,67189,null,null}, {"Jul",671801,73289,null,null}, {"Aug",89222,81299,null,null}, {"Sep",68919,91200,null,null}, {"Oct",74940,99188,null,null}, {"Nov",81991,106181,null,null}, {"Dec",62188,89128,null,null} }); // Set formula for difference in column D and VarianceSparkline formula in column E for (int i = 3; i < 15; i++) { worksheet.Cells[$"D{i}"].Formula = "(C" + i + "-B" + i + ")"; worksheet.Cells[$"E{i}"].Formula2 = "VARISPARKLINE(ROUND((D" + i + ")/(B" + i + "),2),0,-1,1,,0.2,TRUE)"; } |
|
| Visual Basic |
Copy Code
|
|---|---|
'Get sheet Dim worksheet = FpSpread1_Sheet1.AsWorksheet() 'Set data worksheet.SetValue(1, 0, New Object(,) { {"Sales", "Year 2019", "Year 2020", "Variance", "Variance %"}, {"Jan", 65431, 74930, Nothing, Nothing}, {"Feb", 83478, 92730, Nothing, Nothing}, {"Mar", 90021, 12301, Nothing, Nothing}, {"Apr", 72809, 23939, Nothing, Nothing}, {"May", 103832, 34719, Nothing, Nothing}, {"Jun", 832833, 67189, Nothing, Nothing}, {"Jul", 671801, 73289, Nothing, Nothing}, {"Aug", 89222, 81299, Nothing, Nothing}, {"Sep", 68919, 91200, Nothing, Nothing}, {"Oct", 74940, 99188, Nothing, Nothing}, {"Nov", 81991, 106181, Nothing, Nothing}, {"Dec", 62188, 89128, Nothing, Nothing} }) 'Set formula for difference in column D and VarianceSparkline formula in column E For i As Integer = 3 To 15 - 1 worksheet.Cells($"D{i}").Formula = "(C" & i & "-B" & i & ")" worksheet.Cells($"E{i}").Formula2 = "VARISPARKLINE(ROUND((D" & i & ")/(B" & i & "),2),0,-1,1,,0.2,TRUE)" Next |
|
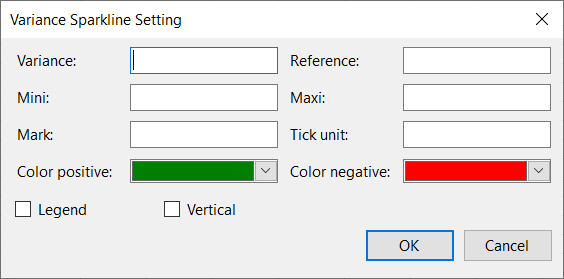
Set the additional sparkline settings as shown in the image above.