You can create a small graph in a cell that uses data from a range of cells. The data for the sparkline is limited to one column or row of values. You can set the sparkline type to column, line, or winloss.
The column sparkline draws the values as a column chart. The line sparkline draws the values as a line chart. The winloss sparkline shows the points with the same size. Negative points extend down from the axis and positive points extend up.
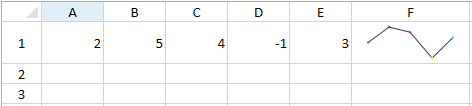
The following image displays a line type:
The graphs can display colors for the marker points. You can set colors for the high, low, negative, first, and last points.
The graphs have horizontal and vertical axes.
Sparklines are stored as groups. A group contains at least one sparkline. You can group and ungroup sparklines.
For more information, see the following: