You can create 3D chart types such as Area3D, AreaStacked3D, AreaStacked100pc3D, BarStacked3D, BarStacked100pc3D, Column3D, ColumnStacked3D, ColumnStacked100pc3D, Line3D, Pie3D, PieExploded3D, and surface charts.
The following image displays a 3D pie chart.
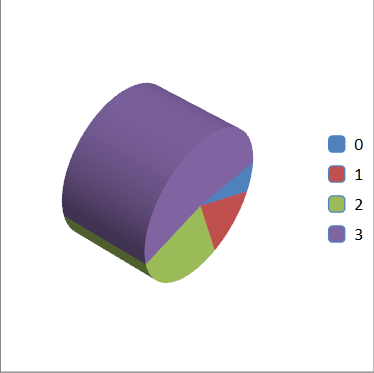
The chart type must be a 3D type to create a 3D chart. You can also specify the perspective and rotation with the View3DSettings class.
The following code creates a 3D pie chart.
| CS |
Copy Code
|
|---|---|
| GrapeCity.Windows.SpreadSheet.Data.SpreadDataSeries series0 = new GrapeCity.Windows.SpreadSheet.Data.SpreadDataSeries(); series0.Name = "Series 0"; series0.Values.Add(1.0); series0.Values.Add(2.0); series0.Values.Add(4.0); series0.Values.Add(8.0); GrapeCity.Windows.SpreadSheet.Data.SpreadChart chart = new GrapeCity.Windows.SpreadSheet.Data.SpreadChart(); chart.DataSeries.Add(series0); chart.ChartType = GrapeCity.Windows.SpreadSheet.Data.SpreadChartType.Pie3D; chart.Name = "name1"; chart.View3D.Perspective = 10; chart.View3D.RotationX = 5; chart.View3D.RotationZ = 5; chart.View3D.RotationY = 5; this.gcSpreadSheet1.ActiveSheet.Charts.Add(chart); |
|
| VB.NET |
Copy Code
|
|---|---|
| Dim series0 As New GrapeCity.Windows.SpreadSheet.Data.SpreadDataSeries() series0.Name = "Series 0" series0.Values.Add(1.0) series0.Values.Add(2.0) series0.Values.Add(4.0) series0.Values.Add(8.0) Dim chart As New GrapeCity.Windows.SpreadSheet.Data.SpreadChart() chart.DataSeries.Add(series0) chart.ChartType = GrapeCity.Windows.SpreadSheet.Data.SpreadChartType.Pie3D chart.Name = "name1" chart.View3D.Perspective = 10 chart.View3D.RotationX = 5 chart.View3D.RotationZ = 5 chart.View3D.RotationY = 5 GcSpreadSheet1.ActiveSheet.Charts.Add(chart) |
|