An axis is used to display the scale for a single dimension of a plot area. There are three axis types: x-axis, y-axis, and z-axis.
An axis can have a title, ruler line, major and minor tick marks, and major and minor grid lines.
You can set the font, background, foreground, and border for the axis. You can also set the fill for major grid lines, as well as for minor grid lines. You can specify lines for the tick marks and grid lines. You can set the height for major and minor tick marks.
Use the Axis class to set styles, titles, tick marks or lines, and grid lines.
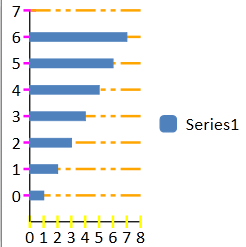
The following example creates major tick marks and lines.
| CS |
Copy Code
|
|---|---|
GrapeCity.Windows.SpreadSheet.Data.SpreadChart chart = new GrapeCity.Windows.SpreadSheet.Data.SpreadChart("Chart", GrapeCity.Windows.SpreadSheet.Data.SpreadChartType.BarStacked, "Sheet1!$A$1:$A$7", 0,0, 200, 200); gcSpreadSheet1.ActiveSheet.SetArray(0, 0, new object[,] { { 1 }, { 2 }, { 3 }, { 4 }, { 5 }, { 6 }, { 7 }, { 8 }, { 9 }, { 10 } }); chart.AxisX.MajorGridlinesStroke = new SolidColorBrush(Colors.Crimson); chart.AxisX.MajorGridlinesStrokeDashType = GrapeCity.Windows.SpreadSheet.Data.StrokeDashType.LongDashDotDot; chart.AxisX.MajorGridlinesStrokeThickness = 2; chart.AxisX.MajorTickHeight = 10; chart.AxisX.MajorTickPosition = GrapeCity.Windows.SpreadSheet.Data.AxisTickPosition.Cross; chart.AxisX.MajorTickStroke = new SolidColorBrush(Colors.DarkGoldenrod); chart.AxisX.MajorTickThickness = 2; chart.AxisY.MajorGridlinesStroke = new SolidColorBrush(Colors.Aqua); chart.AxisY.MajorGridlinesStrokeDashType = GrapeCity.Windows.SpreadSheet.Data.StrokeDashType.LongDashDotDot; chart.AxisY.MajorGridlinesStrokeThickness = 2; chart.AxisY.MajorTickHeight = 10; chart.AxisY.MajorTickPosition = GrapeCity.Windows.SpreadSheet.Data.AxisTickPosition.Cross; chart.AxisY.MajorTickStroke = new SolidColorBrush(Colors.Beige); chart.AxisY.MajorTickThickness = 2; gcSpreadSheet1.ActiveSheet.Charts.Add(chart); |
|
| VB.NET |
Copy Code
|
|---|---|
Dim chart As New GrapeCity.Windows.SpreadSheet.Data.SpreadChart("Chart", GrapeCity.Windows.SpreadSheet.Data.SpreadChartType.BarStacked, "Sheet1!$A$1:$A$7", 0, 0, 200, 200) GcSpreadSheet1.ActiveSheet.SetArray(0, 0, New Object(,) {{1}, {2}, {3}, {4}, {5}, {6}, {7}, {8}, {9}, {10}}) chart.AxisX.MajorGridlinesStroke = New SolidColorBrush(Colors.Crimson) chart.AxisX.MajorGridlinesStrokeDashType = GrapeCity.Windows.SpreadSheet.Data.StrokeDashType.LongDashDotDot chart.AxisX.MajorGridlinesStrokeThickness = 2 chart.AxisX.MajorTickHeight = 10 chart.AxisX.MajorTickPosition = GrapeCity.Windows.SpreadSheet.Data.AxisTickPosition.Cross chart.AxisX.MajorTickStroke = New SolidColorBrush(Colors.DarkGoldenrod) chart.AxisX.MajorTickThickness = 2 chart.AxisY.MajorGridlinesStroke = New SolidColorBrush(Colors.Aqua) chart.AxisY.MajorGridlinesStrokeDashType = GrapeCity.Windows.SpreadSheet.Data.StrokeDashType.LongDashDotDot chart.AxisY.MajorGridlinesStrokeThickness = 2 chart.AxisY.MajorTickHeight = 10 chart.AxisY.MajorTickPosition = GrapeCity.Windows.SpreadSheet.Data.AxisTickPosition.Cross chart.AxisY.MajorTickStroke = New SolidColorBrush(Colors.Beige) chart.AxisY.MajorTickThickness = 2 GcSpreadSheet1.ActiveSheet.Charts.Add(chart) |
|