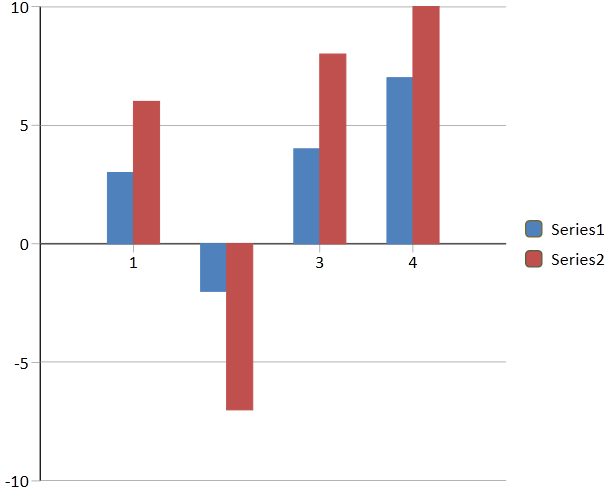
You can add different types of column charts such as Column3D, ColumnClustered, ColumnStacked, ColumnStacked100pc, ColumnStacked100pc3D, and ColumnStacked3D. The following image displays a clustered column chart.
The following code creates a column chart.
| CS |
Copy Code
|
|---|---|
| GrapeCity.Windows.SpreadSheet.Data.SpreadDataSeries ds = new GrapeCity.Windows.SpreadSheet.Data.SpreadDataSeries(); ds.Values.Add(3); ds.Values.Add(-2); ds.Values.Add(4); ds.Values.Add(7); GrapeCity.Windows.SpreadSheet.Data.SpreadDataSeries ds2 = new GrapeCity.Windows.SpreadSheet.Data.SpreadDataSeries(); ds2.Values.Add(6); ds2.Values.Add(-7); ds2.Values.Add(8); ds2.Values.Add(10); GrapeCity.Windows.SpreadSheet.Data.SpreadChart chart = gcSpreadSheet1.ActiveSheet.AddChart("chart", GrapeCity.Windows.SpreadSheet.Data.SpreadChartType.ColumnClustered, 50, 50, 500, 400); chart.DataSeries.Add(ds); chart.DataSeries.Add(ds2); |
|
| VB.NET |
Copy Code
|
|---|---|
| Dim ds As New GrapeCity.Windows.SpreadSheet.Data.SpreadDataSeries() ds.Values.Add(3) ds.Values.Add(-2) ds.Values.Add(4) ds.Values.Add(7) Dim ds2 As New GrapeCity.Windows.SpreadSheet.Data.SpreadDataSeries() ds2.Values.Add(6) ds2.Values.Add(-7) ds2.Values.Add(8) ds2.Values.Add(10) Dim chart = GcSpreadSheet1.ActiveSheet.AddChart("chart", GrapeCity.Windows.SpreadSheet.Data.SpreadChartType.ColumnClustered, 50, 50, 500, 400) chart.DataSeries.Add(ds) chart.DataSeries.Add(ds2) |
|