A plot area is the graphics area in which data points (bars, points, lines) are drawn. A plot area will contain a collection of series. Each series is a collection of data points. A plot area may also contain an axis(s). The axis(s) enhances the visual appearance of the plot area and is usually painted just outside the plot area.
You can set the background and border for the plot area.
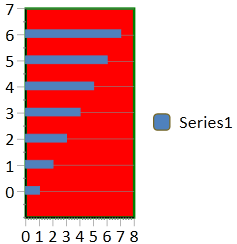
The following example sets a background for the plot area.
| CS |
Copy Code
|
|---|---|
| private double strokeThickness; private Brush stroke; private Brush fillBrush; private double chartFontSize; private double axisFontSize; private FontFamily fontFamily; private FontStyle fontStyle; private FontWeight fontWeight; private FontStretch fontStretch; private Brush foreground; strokeThickness = 2; stroke = new SolidColorBrush(Colors.Green); fillBrush = new SolidColorBrush(Colors.Red); GrapeCity.Windows.SpreadSheet.Data.SpreadChart chart = new GrapeCity.Windows.SpreadSheet.Data.SpreadChart("Chart", GrapeCity.Windows.SpreadSheet.Data.SpreadChartType.BarStacked, "Sheet1!$A$1:$A$7", 0, 0, 200, 200); gcSpreadSheet1.ActiveSheet.SetArray(0, 0, new object[,] { { 1 }, { 2 }, { 3 }, { 4 }, { 5 }, { 6 }, { 7 }, { 8 }, { 9 }, { 10 } }); chart.PlotArea.Stroke = stroke; chart.PlotArea.StrokeThickness = strokeThickness; chart.PlotArea.StrokeDashType = GrapeCity.Windows.SpreadSheet.Data.StrokeDashType.LongDashDotDot; chart.PlotArea.Fill = fillBrush; gcSpreadSheet1.ActiveSheet.Charts.Add(chart); |
|
| VB.NET |
Copy Code
|
|---|---|
| Private strokeThickness As Double Private stroke As Brush Private fillBrush As Brush Private chartFontSize As Double Private axisFontSize As Double Private fontFamily As FontFamily Private fontStyle As FontStyle Private fontWeight As FontWeight Private fontStretch As FontStretch Private foreground As Brush strokeThickness = 2 stroke = New SolidColorBrush(Colors.Green) fillBrush = New SolidColorBrush(Colors.Red) Dim chart As New GrapeCity.Windows.SpreadSheet.Data.SpreadChart("Chart", GrapeCity.Windows.SpreadSheet.Data.SpreadChartType.BarStacked, "Sheet1!$A$1:$A$7", 0, 0, 200, 200) GcSpreadSheet1.ActiveSheet.SetArray(0, 0, New Object(,) {{1}, {2}, {3}, {4}, {5}, {6}, {7}, {8}, {9}, {10}}) chart.PlotArea.Stroke = stroke chart.PlotArea.StrokeThickness = strokeThickness chart.PlotArea.StrokeDashType = GrapeCity.Windows.SpreadSheet.Data.StrokeDashType.LongDashDotDot chart.PlotArea.Fill = fillBrush GcSpreadSheet1.ActiveSheet.Charts.Add(chart) |
|