The chart title is a separate area used to display the title of the chart. You can set the font, background color, foreground color, and border for the chart title.
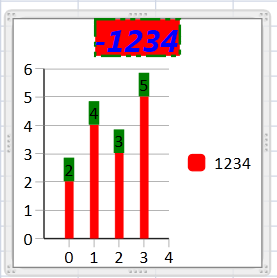
The following example sets the font, background color, foreground color, and border for the chart title.
| CS |
Copy Code
|
|---|---|
private double strokeThickness; private Brush stroke; private Brush fillBrush; private double chartFontSize; private double axisFontSize; private FontFamily fontFamily; private FontStyle fontStyle; private FontWeight fontWeight; private FontStretch fontStretch; private Brush foreground; // Add to Form load event strokeThickness = 2; stroke = new SolidColorBrush(Colors.Green); fillBrush = new SolidColorBrush(Colors.Red); foreground = new SolidColorBrush(Colors.Blue); chartFontSize = 25; axisFontSize = 25; fontFamily = new FontFamily("Arial Narrow"); fontStyle = FontStyles.Italic; fontWeight = FontWeights.Bold; fontStretch = FontStretches.ExtraExpanded; GrapeCity.Windows.SpreadSheet.Data.SpreadDataSeries aseries = new GrapeCity.Windows.SpreadSheet.Data.SpreadDataSeries(); aseries.Name = "1234"; aseries.Values.Add(2); aseries.Values.Add(4); aseries.Values.Add(3); aseries.Values.Add(5); aseries.Fill = new SolidColorBrush(System.Windows.Media.Colors.Red); aseries.ChartType = GrapeCity.Windows.SpreadSheet.Data.SpreadChartType.ColumnStacked; aseries.DataLabelSettings = new GrapeCity.Windows.SpreadSheet.Data.DataLabelSettings() { ShowValue = true, ShowBubbleSize = true }; aseries.DataLabelStyle.Fill = new SolidColorBrush(System.Windows.Media.Colors.Green); GrapeCity.Windows.SpreadSheet.Data.SpreadChart chart = new GrapeCity.Windows.SpreadSheet.Data.SpreadChart(); chart.DataSeries.Add(aseries); chart.Name = "name1"; chart.ChartTitle = new GrapeCity.Windows.SpreadSheet.Data.ChartTitle(); chart.ChartTitle.Text = "-1234"; //stroke chart.ChartTitle.StrokeDashType = GrapeCity.Windows.SpreadSheet.Data.StrokeDashType.LongDashDotDot; chart.ChartTitle.StrokeThickness = strokeThickness; chart.ChartTitle.Stroke = stroke; //fill chart.ChartTitle.Fill = fillBrush; //font chart.ChartTitle.FontSize = chartFontSize; chart.ChartTitle.FontFamily = FontFamily; chart.ChartTitle.FontStyle = fontStyle; chart.ChartTitle.FontWeight = fontWeight; chart.ChartTitle.FontStretch = fontStretch; chart.ChartTitle.Foreground = foreground; gcSpreadSheet1.ActiveSheet.Charts.Add(chart); |
|
| VB.NET |
Copy Code
|
|---|---|
Private strokeThickness As Double Private stroke As Brush Private fillBrush As Brush Private chartFontSize As Double Private axisFontSize As Double Private fontFamily As FontFamily Private fontStyle As FontStyle Private fontWeight As FontWeight Private fontStretch As FontStretch Private foreground As Brush ' Add to Form load event strokeThickness = 2 stroke = New SolidColorBrush(Colors.Green) fillBrush = New SolidColorBrush(Colors.Red) foreground = New SolidColorBrush(Colors.Blue) chartFontSize = 25 axisFontSize = 25 fontFamily = New FontFamily("Arial Narrow") fontStyle = FontStyles.Italic fontWeight = FontWeights.Bold fontStretch = FontStretches.ExtraExpanded Dim aseries As New GrapeCity.Windows.SpreadSheet.Data.SpreadDataSeries() aseries.Name = "1234" aseries.Values.Add(2) aseries.Values.Add(4) aseries.Values.Add(3) aseries.Values.Add(5) aseries.Fill = New SolidColorBrush(System.Windows.Media.Colors.Red) aseries.ChartType = GrapeCity.Windows.SpreadSheet.Data.SpreadChartType.ColumnStacked aseries.DataLabelSettings = New GrapeCity.Windows.SpreadSheet.Data.DataLabelSettings() With {.ShowValue = True, .ShowBubbleSize = True} aseries.DataLabelStyle.Fill = New SolidColorBrush(System.Windows.Media.Colors.Green) Dim chart As New GrapeCity.Windows.SpreadSheet.Data.SpreadChart() chart.DataSeries.Add(aseries) chart.Name = "name1" chart.ChartTitle = New GrapeCity.Windows.SpreadSheet.Data.ChartTitle() chart.ChartTitle.Text = "-1234" 'stroke chart.ChartTitle.StrokeDashType = GrapeCity.Windows.SpreadSheet.Data.StrokeDashType.LongDashDotDot chart.ChartTitle.StrokeThickness = strokeThickness chart.ChartTitle.Stroke = stroke 'fill chart.ChartTitle.Fill = fillBrush 'font chart.ChartTitle.FontSize = chartFontSize chart.ChartTitle.FontFamily = fontFamily chart.ChartTitle.FontStyle = fontStyle chart.ChartTitle.FontWeight = fontWeight chart.ChartTitle.FontStretch = fontStretch chart.ChartTitle.Foreground = foreground GcSpreadSheet1.ActiveSheet.Charts.Add(chart) |
|