High-Speed Excel-Like Pivot Grids and Charts
Process and aggregate thousands of rows in milliseconds with no server-side dependencies
- Incorporate Wijmo's Excel-like web-based pivot tables and charts
- Interpret data types and intelligently place fields in an intuitive, modern UI with our PivotPanel
- Connect your Microsoft SSAS cubes directly to Wijmo's OLAP controls
- First-class Angular, React, and Vue support
Overview
JavaScript OLAP (Online Analytical Processing) is a powerful technology behind many Business Intelligence (BI) applications. It assists users in tasks such as data discovery, performing complex analytical calculations and predictive "what if" scenarios, budget planning, and forecast planning.
Why Choose Wijmo's High-Speed Excel-Like Pivot Tables and Charts?
Increase User Productivity
Wijmo's OLAP module includes the ability to allow users to save and load views, process large amounts of data asynchronously, and run background work on the data. This allows users to increase productivity by processing more data at a time.
Server-Side OLAP Support
Use the ComponentOne Web API on your server to add server-side support to Wijmo's OLAP controls. This will allow you to offload features from the client to the server, such as data sorting and filtering. Requires ComponentOne Web API.
Connects Directly to Microsoft SSAS Cubes
Bind your PivotGrid or PivotChart controls directly to your existing SQL Server Analysis Service cubes. Does not require the ComponentOne Web API.
Built for Speed
Wijmo's OLAP controls are optimized for speed and efficiency. Process, aggregate, sort, and filter hundreds of thousands of rows of data in milliseconds.
Excel-Like Panel Design
Wijmo's Pivot Panel provides users with a familiar, Excel-like panel for managing your data. Select the fields to add to your PivotGrid or PivotChart, determine what fields to filter by, and set your row and column fields.
Multiple Ways to View your Data
Display your data in a PivotGrid or PivotChart, and use OLAP's Slicer module to allow users to quickly and easily change the data being viewed.
OLAP Features

OLAP Outline Mode
Wijmo's JavaScript PivotGrid control allows you to render row fields in an outline format, similar to what Excel offers with their pivot tables. Outline mode is more compact and reduces the amount of whitespace displayed on screen.

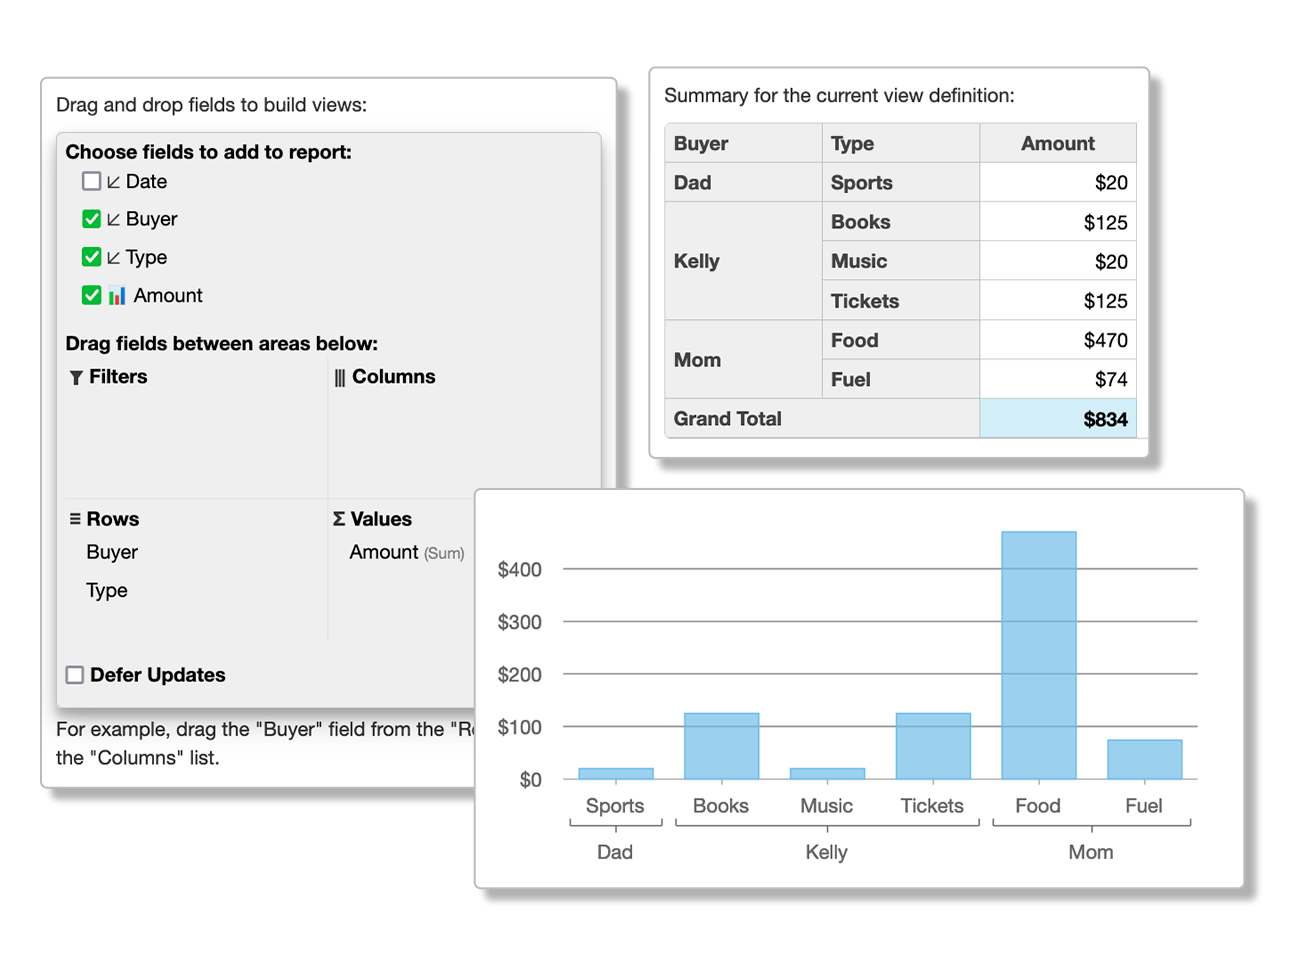
Drag and Drop Pivot Fields in the Smart PivotPanel
- Feels familiar to users with the Excel-like panel design feel
- Allows users to drag fields into “view” lists representing row, column, value, and filter
- Save time with smart data interpretation—panel intelligently places fields, and build-in save/load views
- Use the same field multiple times in values
- Asynchronous processing provides a progress bar and background work
- Read more about creating basic pivot tables
- See how to answer recurring questions with pre-defined views

Display Excel-Like Data Summaries in PivotGrid
Wijmo's JavaScript PivotGrid control displays data summaries generated by the PivotEngine component. It extends the FlexGrid control, allowing you to take advantage of core features including grouping, drill-down, and context menus for editing field properties.

Visualize Large Data Sets With PivotChart
Wijmo's JavaScript PivotChart control displays different charts that visualize the data summaries generated by the PivotEngine component. It extends both the FlexChart and FlexPie controls, meaning that you'll also have access to all of the features of the chart type that you choose.

Visually Filter Data With Slicers
Wijmo's Slicer control allows users to filter data based on values and indicates the current filter state. This makes it easy for users to understand what's being displayed in filtered PivotGrid and PivotChart components.

Server-Side OLAP Support
Client-side OLAP engine: Wijmo’s Pivot components were created for analyzing datasets on the client. Our client-side OLAP engine can handle relatively large amounts of data (in the order of hundreds of thousands of records), but it requires the raw data to be downloaded to the client, and that makes it impractical to analyze really large datasets (millions of records), so we've added server-side options.
Direct connection to Microsoft SSAS cubes: There's no need for the server-side API if you already have Microsoft SSAS cubes in place! Learn more in the blog.
Optional server-side support: Use a URL in the itemSource property to instruct the OLAP components to query a Web API on the server instead of analyzing an array on the client. The server-side engine is part of our ASP.NET MVC product line and must be installed and licensed separately. We recommend purchasing Ultimate so that you have both server and client-side components for our OLAP components.

Customizing Cells
The PivotGrid control allows you to heavily customize the look, feel, and functionality of every cell within the pivot table to match your style requirements. You're able to conditionally style cells, add custom components and sparklines to cells, and dynamically update cells within the PivotGrid.

Exporting Content
Both PivotGrid and PivotChart support exporting their content. Wijmo's PivotGrid control allows users to export the pivot table to either XLSX, CSV, or PDF, while the PivotChart allows users to export the chart as a PNG, JPEG, or SVG image.
All of Wijmo's JavaScript UI Components
Frameworks & Integrations
- Angular
- React
- Vue
- Web Components
- TypeScript
- ES6
Common
Data Management
Printing & Docs
Navigation & Layout
Input & Editors
Viewers
Designers
e= Wijmo Enterprise features
Featured Blogs, Videos, and Other Resources


Trusted by the World's Leading Companies
