Axis grouping refers to the grouping of axis labels, wherever possible, for better readability and data analysis at different levels. Broadly, there can be three types of data based on which implementation of axis grouping also varies: categorical, numerical and DateTime format.
In FlexChart, all these three implementations can be done using the methods discussed in the respective sections below. FlexChart also provides the GroupSeparator property of Axis class that allows you to display the group separator for clear and cleaner division of groups. Moreover, you can allow user to expand or collapse these groups by setting the GroupVisibilityLevel property which accepts an integer value and limits the level of visible collapsible groups. You can also style the groups using the GroupStyle property.
As the name suggests, this type of grouping is done when data is categorical in nature, either flat or hierarchical. For instance, while displaying a country-wise data, you can also group the countries as per the continent and analyze the data of each continent. Another good example could be to analyze the month-wise data which can be grouped into quarters to facilitate the quarterly analysis.
FlexChart provides the GroupNames property to implement grouping on a categorical axis. In case of a hierarchical data, you need to specify the GroupItemsPath property as well to establish the parent-child relationship.
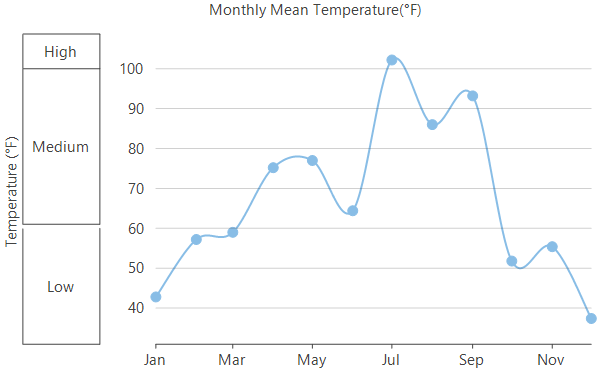
Numerical axis grouping is done to group the numerical data into categories or ranges to which user can easily relate. For example, it is more useful to group the temperature data plotted on Y-axis into low, medium and high ranges. To implement grouping on a numeric type axis in FlexChart, you need to create an instance of the IAxisGroupProvider interface and assign it to the GroupProvider property. The interface also provides the GetLevels and GetRanges method which return the number of group levels and a list of range values for a given level respectively.
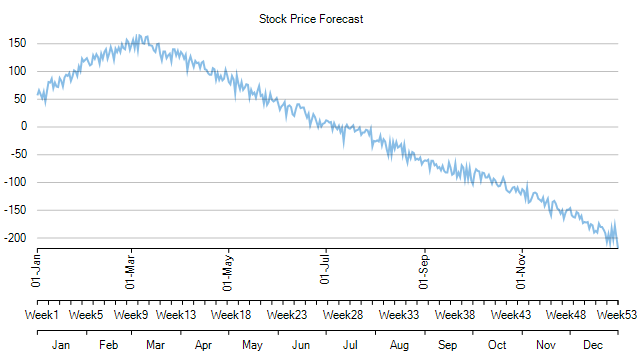
DateTime type data can be grouped into days, weeks, months, quarters or years and hence a DateTime type axis can also be grouped in all these ways. For instance, the example below categorizes the date-wise data plotted on X-axis into weeks and then further into months. For implementing grouping on a DateTime axis in FlexChart, you need to set the GroupProvider property to an object of DateTimeGroupProvider class. You also need to specify the type of groups (in the terms of TimeUnits) that you want to add by using the GroupTypes property of this class. The DateTimeGroupProvider class also provides the GetLevels and GetRanges method which return the number of group levels and a list of range values for a given level respectively.