3D Pie Chart
In This Topic
Pie charts are useful in showing how the percentage of each data item contributes to the total. This walkthrough illustrates how to create a three dimensional pie chart.
The walkthrough is split up into the following activities:
- Adding a chart control to the report
- Adding a series and data points to the chart
- Setting the chart's properties
When you complete this walkthrough you get a layout that looks similar to the following at design time and at run time.
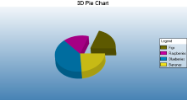
3D Pie Chart
To add an ActiveReport to the Visual Studio project
- Create a new Visual Studio project.
- From the Project menu, select Add New Item.
- In the Add New Item dialog that appears, select ActiveReports 14 Section Report (code-based) and in the Name field, rename the file as 3DPieChart.
- Click the Add button to open a new section report in the designer.
See Quick Start for information on adding different report layouts.
To add the Chart control to the report
- From the toolbox, drag the Chart data region to the body of the report.
- If the chart wizard appears, click Cancel.
Tip: If you do not want the chart wizard to appear each time you add a chart, clear the Auto Run Wizard checkbox. You can still access the wizard via the command verbs (see below).
- In the Properties window, set the following properties.
Property Name Property Value Location 0, 0in Size 6.5, 3.5in - In the Report Explorer, select Detail1 and go to the properties window to set the Height property to 3.5.
- On the design surface, select the grey area outside the report and in the Properties window, set the PrintWidth property to 6.5.
To add a series and data points to the Chart
- With the chart control selected, go to the Properties window and click the Series (Collection) property , then click the ellipsis button (...) that appears.
- In the Series Collection Editor that appears, Series1 is selected by default. There, under Series1 properties, change the following.
Property Name Property Value ColorPalette Confetti Type Doughnut3D - Click the Points (Collection) property, then click the ellipsis button that appears.
- In the DataPoint Collection that appears, click the Add button to add a data point.
- In the DataPoint Collection Editor that appears, go to the Properties window to set the following properties.
Property Name Property Value LegendText Figs YValues 19 Properties>ExplodeFactor 0.5 - Click the Add button to add another data point.
- In the DataPoint Collection Editor that appears, go to the Properties window to set the following properties.
Property Name Property Value LegendText Raspberries YValues 15 - Click the Add button to add another data point.
- In the DataPoint Collection Editor that appears, go to the Properties window to set the following properties.
Property Name Property Value LegendText Blueberries YValues 37 - Click the Add button to add another data point.
- In the DataPoint Collection Editor that appears, go to the Properties window to set the following properties.
Property Name Property Value LegendText Bananas YValues 21 - Click OK to save the data points and return to the Series Collection Editor.
- In the Series Collection Editor under Members, select Series2 and Series3 and click the Remove button.
- Click OK to save the changes and return to the report design surface.
To configure the appearance of the Chart
- With the chart control selected, go to the Properties window and click the ChartAreas (Collection) property and then click the ellipsis button that appears.
- In the ChartArea Collection Editor that appears, expand the Projection property node and set the VerticalRotation property to 50. This allows you to see more of the top of the pie.
- Click OK to return to the report design surface.
- With the chart control highlighted, go to the Properties window and click the Titles (Collection) property and then click the ellipsis button that appears.
- In the Title Collection Editor that appears, under header properties, set the following properties.
Property Name Property Value Text 3D Pie Chart Font Size 14 - Under Members, select the footer and click the Remove button.
- Click OK to return to the report design surface.
To view the report
- Click the preview tab to view the report at design time.
OR
- Open the report in the Viewer. See Windows Forms Viewer for further information.