Banded List Reports
In This Topic
You can create a freeform report with groups using the Banded List control. This walkthrough illustrates how to create a grouped BandedList report.
The walkthrough is split up into the following activities:
- Adding an ActiveReport to a Visual Studio project
- Connecting the report to a data source
- Adding a dataset
- Adding a banded list with grouping
- Adding controls to the banded list
- Viewing the report
Note:
- This walkthrough uses the Movie table from the Reels database. The Reels.mdb file can be downloaded from GitHub: ..\Samples14\Data\Reels.mdb..
- Although this walkthrough uses Page reports, you can also implement this using RDL reports.
When you complete this walkthrough you get a layout that looks similar to the following at design time and at run time.
Design-Time Layout
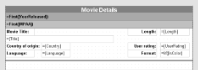
Banded List Report at design time
Run-Time Layout
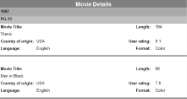
Banded List Report at run time
To add an ActiveReport to the Visual Studio project
- Create a new Visual Studio project.
- From the Project menu, select Add New Item.
- In the Add New Item dialog that appears, select ActiveReports 14 Page Report and in the Name field, rename the file as rptBandedList.
- Click the Add button to open a new fixed page report in the designer.
See Quick Start for information on adding different report layouts.
To connect the report to a data source
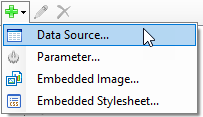
- In the Report Explorer, right-click the Data Sources node and select the Add Data Source option or select Data Source from the Add button.
- In the Report Data Source Dialog that appears, select the General page and in the Name field, enter a name like ReportData.
- On this page, create a connection to the Reels database. See Connect to a Data Source for information on connecting to a data source.
To add a dataset
- In the Report Explorer, right-click the data source node and select the Add Data Set option.
- In the DataSet Dialog that appears, select the General page and enter the name of the dataset as Movies. This name appears as a child node to the data source icon in the Report Explorer.
- On the Query page of this dialog, change the Command Type to TableDirect and enter Movie into the Query text box.
- Click the Validate DataSet icon at the top right hand corner above the Query box to validate the query.

- Click OK to close the dialog. Your data set and queried fields appear as nodes in the Report Explorer.
To add the BandedList with grouping
- From the toolbox, drag a BandedList data region onto the design surface and go to the properties window to set the DataSetName property to Movies.
Note: To select the banded list, click inside any band in the list and click the four-way arrow that appears at the top left of the control. - Right-click inside the banded list and select Footer. This removes the footer band that we are not using in this walkthrough.
- Right-click inside the banded list and select Insert Group. This adds a group header between the BandedList header and the detail section, and a group footer below the detail section, and opens the BandedList - Groups dialog.
- In the BandedList - Groups dialog, drop down the list of expressions in the Group on expression box and select =Fields!YearReleased.Value to group the movies based on the year in which they were released.
- In the same dialog, change the Name to Year.
- In the same dialog under Layout, clear the Include group footer checkbox to remove the group footer.
- Click the Add icon. This adds a second group header under the first, and a group footer below the detail section.
- In the same dialog, select the newly added group from the list of groups, drop down the list of expressions in the Group on expression box and select =Fields!MPAA.Value to group the movies based on the rating (for example, G, PG, etc).
- In the same dialog, change the Name to MPAA.
- In the same dialog under Layout, clear the Include group footer checkbox to remove the group footer.
- Click OK to close the dialog.
To add controls to the BandedList
- From the toolbox, drag a TextBox control onto the top-most band (BandedList1_Header) and in the Properties window, set the following properties:
Property Name Property Value BackgroundColor Gray Color White FontSize 14pt FontWeight Bold Location 0in, 0in Size 6.5in, 0.25in TextAlign Center Value Movie Details - Click the BandedList1_Header band adorner (the grey bar along the top of the band) to select the banded list header.
- In the Properties window, set the following properties for the banded list header:
Property Name Property Value RepeatOnNewPage True Height 0.25in - From the Report Explorer drag the YearReleased field onto the first grouping band (Year_Header) of the banded list.
- With this field selected, go to the Properties window to set the following properties:
Property Name Property Value BackgroundColor DarkGray FontWeight Bold Location 0in, 0in Size 6.5in, 0.25in TextAlign Left Value =First(Fields!YearReleased.Value) - Click the Year_Header band adorner (the grey bar along the top of the band) to select it and go to the properties window to set the Height property of the header band to 0.25in.
- From the Report Explorer, drag the MPAA field into the second grouping band (MPAA_Header) of the banded list.
- Go to the Properties window to set the following properties:
Property Name Property Value BackgroundColor Silver BorderColor Gray BorderStyle Solid FontWeight Bold Location 0in, 0in Size 6.5in, 0.25in Note: The Value property is automatically set to an expression using the First aggregate. This displays the movie rating for each group. - Click the MPAA_Header band adorner (the grey bar along the top of the band) to select it and go to the properties window to set the Height property of the header band to 0.25in.
- Click inside the detail band to select it and in the properties window, set its Height property to 1.2in.
- From the Report Explorer, drag the following six fields onto the detail band and in the properties window, set their properties as indicated.
Data Field Property Name Title Location: 0in, 0.25in
Size: 3.75in, 0.25inCountry Location: 1.25in, 0.5in
Size: 1in, 0.25inLanguage Location: 1.25in, 0.75in
Size: 1in, 0.25inLength Location: 5.375in, 0in
Size: 1in, 0.25in
TextAlign = LeftUserRating Location: 5.375in, 0.5in
Size: 1in, 0.25in
TextAlign = LeftIsColor Location: 5.375in, 0.75in
Size: 1in, 0.25inNote: When you drag and drop fields from a dataset in the Report Explorer onto the design surface, these fields are automatically converted to Textbox controls that you can modify by setting the control properties in the Properties Window. - Once you've arranged the fields, select the IsColor field and in the properties window, change the Value property to the following expression so that instead of "True" or "False," it will read "Color" or "Black and White."
=Iif(Fields!IsColor.Value=True, "Color", "Black and White") - From the toolbox, drag six TextBox controls onto the detail band and in the properties window, set their properties as indicated.
TextBox1
Property Name Property Value Value Movie Title: Location 0in, 0in Size 1in, 0.25in FontWeight Bold TextBox2
Property Name Property Value Value Country of origin: Location 0in, 0.5in Size 1.25in, 0.25in FontWeight Bold TextBox3
Property Name Property Value Value Language: Location 0in, 0.75in Size 1in, 0.25in FontWeight Bold TextBox4
Property Name Property Value Value Length: Location 4.25in, 0in Size 1in, 0.25in FontWeight Bold TextAlign Right TextBox5
Property Name Property Value Value User Rating: Location 4.25in, 0.5in Size 1in, 0.25in FontWeight Bold TextAlign Right TextBox6
Property Name Property Value Value Format: Location 4.25in, 0.75in Size 1in, 0.25in FontWeight Bold TextAlign Right - From the toolbox, drag a Line control onto the detail band and in the Properties window, set the properties.
Property Name Property Value LineColor Gray LineWidth 3pt Location 0in, 1.12in EndPoint 6.5in, 1.12in - For a Page report, in the Report Explorer select the BandedList control and in the Properties window, set its FixedSize property to 6.5in, 7in.
To view the report
- Click the preview tab to view the report at design time.
OR
- Open the report in the Viewer. See Windows Forms Viewer for further information.