This walkthrough illustrates a step-by-step implementation for creating a report which uses the Tablix data region to display store numbers and managers by region and district. The report in this walkthrough demonstrates how Tablix cells with same value in a row group area automatically merge to avoid clutter.
The walkthrough is split into the following activities:
- Creating an ActiveReports project in Visual Studio
- Connecting the report to a data source
- Adding a dataset
- Creating a layout for the report
- Enhancing the appearance of the report
- Viewing the report
- This walkthrough uses the Reels database. The Reels.mdb file can be downloaded from GitHub: ..\Samples14\Data\Reels.mdb.
- Although this walkthrough uses RDL reports, you can also implement this using page reports.
When you complete this walkthrough, you will have a layout that looks similar to the following at design time and at run time.
Design-Time Layout
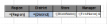
Cell merging in Tablix at design time
Run-Time Layout
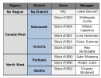
Cell merging in Tablix at run time
To create an ActiveReports project in Visual Studio
- Create a new Visual Studio project.
- In the New Project dialog that appears, select ActiveReports 14 RDL Report Application and in the Name field, name the file rptTablix.
- Click OK to create a new ActiveReports 14 RDL Report Application. By default an RDL report is added to the project.
See Quick Start to a Project for information on adding different report layouts.
To connect a report to a data source
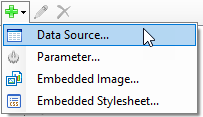
- In the Report Explorer, right-click the Data Sources node and select the Add Data Source option or select Data Source from the Add button.
- In the Report Data Source Dialog that appears, select the General page and in the Name field, enter a name like ReportData.
- On this page, create a connection to the Reels database. See Connect to a Data Source for information on connecting to a data source.
To add a dataset
- In the Report Explorer, right-click the Data Sources node and select the Add Data Set option or select Data Set from the Add button.
- In the DataSet Dialog that appears, select the General page and name the dataset StoreDetails. This name appears as a child node of the data source icon in the Report Explorer.
- On the Query page of this dialog, in the Query field enter the following SQL query.
SQL Query Copy CodeSELECT Regions.RegionID, Regions.Region, Districts.DistrictID, Districts.District, Store.StoreName, Person.FirstName, Person.LastName FROM ((Regions INNER JOIN Districts ON Regions.RegionID = Districts.Region) INNER JOIN Store ON Districts.DistrictID = Store.DistrictID) INNER JOIN Person ON Store.Manager = Person.PersonID;
- Click the Validate DataSet icon at the top right hand corner above the Query box to validate the query.

- Click OK to close the dialog. Your data set and queried fields appear as nodes in the Report Explorer.
To create a layout for the report
- From the toolbox, drag a Tablix data region onto the designer surface of the report.
- Hover over TextBox3 to reveal the field selection adorner, click it to display a list of available fields, and select the Region field. This a row group cell, and selecting a field in it automatically adds a row group.
- Select TextBox1 above the Region row group cell, and in the Properties window set the Value property to Region. This is the heading for the row group.
- Right-click TextBox3 where the Region field was added in the Tablix data region, select Add Row Group, and then select the Child Group option. The child group is added to the right of the row header and is listed under the Group Editor window.
- Hover over TextBox5 to reveal the field selection adorner, click it to display a list of available fields, and select the District field. This a row group cell, and selecting a field in it automatically adds a row group.
- Select Textbox6 above the District row group cell, and in the Properties window set the Value property to District. This is the heading for the row group.
- Right-click TextBox5 where the District field was added in the Tablix data region, select Add Row Group, and then select the Child Group option. The child group is added next to the new row group and is listed under the Group Editor window.
- Hover over TextBox7 to reveal the field selection adorner, click it to display a list of available fields, and select the StoreName field. This a row group cell, and selecting a field in it automatically adds a row group.
- Select Textbox8 above the StoreName row group cell, and in the Properties window set the Value property to Store. This is the heading for row group.
- Right click Textbox8 above the StoreName row group cell, select Insert Column, and then select Right. This adds a new static column.
- Hover over TextBox9 to reveal the field selection adorner, click it to display a list of available fields, and select the FirstName field.
- With TextBox9 selected, in the Properties window set the Value property to =Fields!FirstName.Value & " " & Fields!LastName.Value using expressions.
- Select Textbox10 above the =[FirstName] & " " & [LastName] column cell, and in the Properties window set the Value property to Manager. This is the heading for the static column.
To enhance the appearance of the report
When you preview the report at this point, you will notice the data from the fields is displayed in the Tablix data region. We can enhance the layout of the Tablix data region by setting cell properties in the Properties Window as follows:
| Cell | Property Name | Property Value |
|---|---|---|
| =[Region] | BackgroundColor | Gainsboro |
| BorderStyle | Solid | |
| FontWeight | Bold | |
| TextAlign | Center | |
| VerticalAlign | Middle | |
| Region | BackgroundColor | Gray |
| BorderStyle | Solid | |
| FontWeight | Bold | |
| TextAlign | Center | |
| =[District] | BackgroundColor | LightSteelBlue |
| BorderStyle | Solid | |
| FontWeight | Bold | |
| TextAlign | Center | |
| VerticalAlign | Middle | |
| District | BackgroundColor | Gray |
| BorderStyle | Solid | |
| FontWeight | Bold | |
| TextAlign | Center | |
| =[StoreName] | BackgroundColor | WhiteSmoke |
| BorderStyle | Solid | |
| TextAlign | Center | |
| Store | BackgroundColor | Gray |
| BorderStyle | Solid | |
| FontWeight | Bold | |
| TextAlign | Center | |
| =[FirstName] & " " & [LastName] | BorderStyle | Solid |
| TextAlign | Center | |
| Manager | BackgroundColor | Gray |
| BorderStyle | Solid | |
| FontWeight | Bold | |
| TextAlign | Center |
To view the report
- Click the preview tab to view the report at design time.
OR
- Open the report in the Viewer. See Windows Forms Viewer for further information.