Chart Annotations
In This Topic
The Chart control offers a built-in annotation tool to allow you to include floating text bars or images in your charts or call attention to specific items or values in your charts using the line and text bar controls included in the Annotations Collection Editor. You can find the Annotations Collection Editor under the Series properties of the Chart Designer.
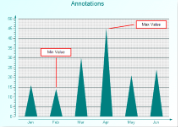
Chart Annotations
The following properties are important while setting up annotations for your chart:
- StartPoint Sets the starting point (X and Y axis values) for an annotation line.
- EndPoint Sets the end point (X and Y axis values) for an annotation line.
- AnchorPlacement Sets the position of the anchor point for the text bar on the chart surface.
- AnchorPoint Sets the point (X and Y axis values) where the text bar will be anchored based on the anchor placement selected.
The following code demonstrates creating annotation lines and annotation text, setting their properties, and adding them to the series annotations collection at run time.
To write code in Visual Basic.NET
| Visual Basic |
Copy Code
|
|---|---|
' create the annotation lines and text bar.
Dim aLine1 As New GrapeCity.ActiveReports.Chart.Annotations.AnnotationLine
Dim aLine2 As New GrapeCity.ActiveReports.Chart.Annotations.AnnotationLine
Dim aText1 As New GrapeCity.ActiveReports.Chart.Annotations.AnnotationTextBar
Dim aText2 As New GrapeCity.ActiveReports.Chart.Annotations.AnnotationTextBar

' set the properties for each line and text bar.
With aLine1
        .EndPoint = New GrapeCity.ActiveReports.Chart.Graphics.Point2d(1.5F, 30.0F)
        .Line = New GrapeCity.ActiveReports.Chart.Graphics.Line(System.Drawing.Color.Red, 2)
        .StartPoint = New GrapeCity.ActiveReports.Chart.Graphics.Point2d(1.5F, 15.0F)
End With
With aLine2
        .EndPoint = New GrapeCity.ActiveReports.Chart.Graphics.Point2d(4.6F, 47.0F)
        .Line = New GrapeCity.ActiveReports.Chart.Graphics.Line(System.Drawing.Color.Red, 2)
        .StartPoint = New GrapeCity.ActiveReports.Chart.Graphics.Point2d(3.6F, 45.0F)
End With
With aText1
        .AnchorPlacement = GrapeCity.ActiveReports.Chart.Annotations.AnchorPlacementType.Bottom
        .AnchorPoint = New GrapeCity.ActiveReports.Chart.Graphics.Point2d(1.5F, 31.0F)
        .Height = 25.0F
        .Line = New GrapeCity.ActiveReports.Chart.Graphics.Line(System.Drawing.Color.Red, 2)
        .Text = "Min Value"
        .Width = 100.0F
End With
With aText2
        .AnchorPlacement = GrapeCity.ActiveReports.Chart.Annotations.AnchorPlacementType.Left
        .AnchorPoint = New GrapeCity.ActiveReports.Chart.Graphics.Point2d(4.7F, 47.0F)
        .Height = 25.0F
        .Line = New GrapeCity.ActiveReports.Chart.Graphics.Line(System.Drawing.Color.Red, 2)
        .Text = "Max Value"
        .Width = 100.0F
End With

' add the annotation lines and text bars to the annotations collection for the series
Me.ChartControl1.Series(0).Annotations.AddRange(New GrapeCity.ActiveReports.Chart.Annotations.Annotation() {aLine1, aLine2, aText1, aText2})
|
|
To write code in C#
| C# |
Copy Code
|
|---|---|
// create the annotation lines and text bar.
GrapeCity.ActiveReports.Chart.Annotations.AnnotationLine aLine1 = new GrapeCity.ActiveReports.Chart.Annotations.AnnotationLine();
GrapeCity.ActiveReports.Chart.Annotations.AnnotationLine aLine2 = new GrapeCity.ActiveReports.Chart.Annotations.AnnotationLine();
GrapeCity.ActiveReports.Chart.Annotations.AnnotationTextBar aText1 = new GrapeCity.ActiveReports.Chart.Annotations.AnnotationTextBar();
GrapeCity.ActiveReports.Chart.Annotations.AnnotationTextBar aText2 = new GrapeCity.ActiveReports.Chart.Annotations.AnnotationTextBar();

// set the properties for each line and text bar.
aLine1.EndPoint = new GrapeCity.ActiveReports.Chart.Graphics.Point2d(1.5F, 30F);
aLine1.Line = new GrapeCity.ActiveReports.Chart.Graphics.Line(System.Drawing.Color.Red, 2);
aLine1.StartPoint = new GrapeCity.ActiveReports.Chart.Graphics.Point2d(1.5F, 15F);
aLine2.EndPoint = new GrapeCity.ActiveReports.Chart.Graphics.Point2d(4.6F, 47F);
aLine2.Line = new GrapeCity.ActiveReports.Chart.Graphics.Line(System.Drawing.Color.Red, 2);
aLine2.StartPoint = new GrapeCity.ActiveReports.Chart.Graphics.Point2d(3.6F, 45F);
aText1.AnchorPlacement = GrapeCity.ActiveReports.Chart.Annotations.AnchorPlacementType.Bottom;
aText1.AnchorPoint = new GrapeCity.ActiveReports.Chart.Graphics.Point2d(1.5F, 31F);
aText1.Height = 25F;
aText1.Line = new GrapeCity.ActiveReports.Chart.Graphics.Line(System.Drawing.Color.Red, 2);
aText1.Text = "Min Value";
aText1.Width = 100F;
aText2.AnchorPlacement = GrapeCity.ActiveReports.Chart.Annotations.AnchorPlacementType.Left;
aText2.AnchorPoint = new GrapeCity.ActiveReports.Chart.Graphics.Point2d(4.7F, 47F);
aText2.Height = 25F;
aText2.Line = new GrapeCity.ActiveReports.Chart.Graphics.Line(System.Drawing.Color.Red, 2);
aText2.Text = "Max Value";
aText2.Width = 100F;

// add the annotation lines and text bars to the annotations collection for the series
this.ChartControl1.Series[0].Annotations.AddRange(
new GrapeCity.ActiveReports.Chart.Annotations.Annotation[] {aLine1, aLine2, aText1, aText2});
|
|
See Also