ActiveReports 14 .NET Edition
ActiveReports 14 User Guide / Concepts / Section Report Concepts / Section Report Toolbox / Chart / Chart Types (Section Reports)
In This Topic
    Chart Types (Section Reports)
    In This Topic

    These topics introduce you to the different Chart Types you can create with the Chart control.
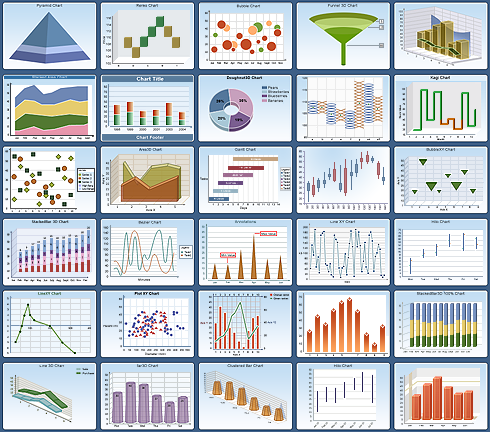
    Chart Types
    Area Chart
    Area2D, StackedArea, StackedArea100Pct, and Area3D
    Bar Chart
    Bar2D and Bar3D 
    Line Chart
    Bezier, Line, LineXY and Line3D
    Pie and Doughnut Charts
    Doughnut/Pie and Doughnut3D/Pie
    Financial Chart
    Candle, HiLo, Renko, Point and Figure, Kagi, Stock, StockOpenClose, and Three Line Break
    Point and Bubble Charts
    Bubble, BubbleXY, Scatter, and PlotXY
    Pyramid Chart Renko Chart Bubble Chart Funnel Chart Multiple Chart Types Stacked Area Chart Stacked Bar Chart Doughnut 3D Chart Point and Figure Chart Kagi Chart Plot XY Chart 3D Area Chart Gantt Chart Candle Chart Bubble XY Chart 3D Stacked Bar Chart Bezier Chart Chart Annotations Line XY Chart HiLoOpenClose Chart Line XY Chart 2 Plot XY Chart 2 Multiple Chart Types 2 Bar Chart with Markers 100 Percent Stacked Bar Chart 3D Line Chart 3D Bar Chart with Custom BarType and 6 Vertices Clustered 3D Bar Chart HiLo Financial Chart Bar Chart with Constant Lines and Stripes