Columnar Layout Reports (RDL)
In This Topic
In RDL report, you can create a columnar report layout by using the Columns property of the report. This walkthrough illustrates how to create a RDL report using columns, and is split up into the following activities:
- Adding an ActiveReport to a Visual Studio project
- Connecting to a the data source
- Adding a dataset
- Creating a column report layout
- Viewing the report
Note: This walkthrough uses the CustomerMailingList table from the Reels database. The Reels.mdb file can be downloaded from GitHub: ..\Samples14\Data\Reels.mdb.
When you complete this walkthrough you get a layout that looks similar to the following at design time and at run time.
Design-Time Layout
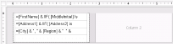
Columnar Layout Reports at design time
Run-Time Layout
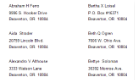
Columnar Layout Reports at run time
To add an ActiveReport to the Visual Studio project
- Create a new Visual Studio project.
- From the Project menu, select Add New Item.
- In the Add New Item dialog that appears, select ActiveReports 14 RDL Report and in the Name field, rename the file as rptRDLColumnLayout.
- Click the Add button to open a new RDL report in the designer.
See Quick Start for information on adding different report layouts.
To connect the report to a data source
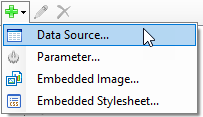
- In the Report Explorer, right-click the Data Sources node and select the Add Data Source option or select Data Source from the Add button.
- In the Report Data Source Dialog that appears, select the General page and in the Name field, enter a name like ReportData.
- On this page, create a connection to the Reels database. See Connect to a Data Source for information on connecting to a data source.
To add a dataset
- In the Report Explorer, right-click the data source node and select the Add Data Set option or select Data Set from the Add button.
- In the DataSet Dialog that appears, select the General page and enter the name of the dataset as CustomerList. This name appears as a child node to the data source icon in the Report Explorer.
- On the Query page of this dialog, in the Query field enter the following SQL query.
SQL Query Copy CodeSELECT TOP 100 * FROM CustomerMailingList UNION SELECT TOP 100 * FROM CustomerMailingList WHERE Country = "USA" ORDER BY 8 DESC - Click the Validate DataSet icon at the top right hand corner above the Query box to validate the query.

- Click OK to close the dialog. Your data set and queried fields appear as nodes in the Report Explorer.
To create a column layout for the report
- In the Report Explorer, select Body and set the following properties in the properties window.
Property Name Property Value Columns 2 ColumnSpacing 0.25in Size 2.625in, 1in - In the Visual Studio toolbox, go to the ActiveReports 14 Page Report tab and drag the List data region onto the design surface.
- In the Properties Window, set the following properties for the List.
Property Name Property Value DataSetName CustomerList Size 2.5in, 1in - In the Visual Studio toolbox, go to the ActiveReports 14 Page Report tab and drag three TextBox controls onto the List data region added above.
- In the Properties Window, set the following properties for TextBox1.
Property Name Property Value Location 0in, 0in Size 2.5in, 0.25in DataElementName FirstName Name FirstName Value =Fields!FirstName.Value & IIF( Fields!MiddleInitial.Value Is Nothing, "", " " & Fields!MiddleInitial.Value ) & " " & Fields!LastName.Value CanGrow False - In the Properties Window, set the following properties for TextBox2.
Property Name Property Value Location 0in, 0.25in Size 2.5in, 0.25in DataElementName CustomerAddress1 Name CustomerAddress1 Value =Fields!Address1.Value & IIF( Fields!Address2.Value is Nothing, "", vbCrLf & Fields!Address2.Value ) CanGrow False CanShrink True - In the Properties window, set the following properties for TextBox3.
Property Name Property Value Location 0in, 0.50in Size 2.5in, 0.25in DataElementName CustomerCity Name CustomerCity Value =Fields!City.Value & ", " & Fields!Region.Value & " " & Fields!PostalCode.Value & " " & IIf( Fields!Country.Value = "USA", "", Fields!Country.Value ) CanGrow False
To view the report
- Click the preview tab to view the report at design time.
OR
- Open the report in the Viewer. See Windows Forms Viewer for further information.
See Also