Constant Lines and Stripes
In This Topic
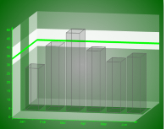
The Chart control supports constant lines and stripes through the use of the WallRanges collection. It allows you to display horizontal or vertical lines or stripes in a chart to highlight certain areas. For example, you could draw a stripe in a chart to draw attention to a high level in the data or draw a line to show the average value of the data presented.
Constant Lines and Stripes
Note: The Chart control does not aggregate average values. Please aggregate the average values beforehand and then render the line.
Important properties
- StartValue Sets the start value on the primary axis for the wall range.
- EndValue Sets the end value on the primary axis for the wall range.
- PrimaryAxis Sets the axis on which the wall range appears.
The following code demonstrates how to create wall ranges, set their properties, and assign them to a chart area at run time. The results are shown in the image above.
To write code in Visual Basic.NET
| Visual Basic code. Paste INSIDE the section Format event |
Copy Code
|
|---|---|
' Create the WallRange objects
Dim wallRange1 As New GrapeCity.ActiveReports.Chart.WallRange
Dim wallRange2 As New GrapeCity.ActiveReports.Chart.WallRange
Dim wallRange3 As New GrapeCity.ActiveReports.Chart.WallRange

' Set WallRange property
With wallRange1
    .Backdrop = New GrapeCity.ActiveReports.Chart.Graphics.Backdrop(Color.White)
    .Border = New GrapeCity.ActiveReports.Chart.Border(New GrapeCity.ActiveReports.Chart.Graphics.Line(Color.Transparent, 0, GrapeCity.ActiveReports.Chart.Graphics.LineStyle.None), 0, Color.Black)
    .EndValue = 40
    .PrimaryAxis = ((CType(Me.ChartControl1.ChartAreas(0).Axes("AxisY"), GrapeCity.ActiveReports.Chart.Axis)))
    .StartValue = 30
End With
With wallRange2
    .Backdrop = New GrapeCity.ActiveReports.Chart.Graphics.Backdrop(Color.Lime)
    .Border = New GrapeCity.ActiveReports.Chart.Border(New GrapeCity.ActiveReports.Chart.Graphics.Line(Color.Transparent, 0, GrapeCity.ActiveReports.Chart.Graphics.LineStyle.None), 0, Color.Black)
    .EndValue = 34
    .PrimaryAxis = ((CType(Me.ChartControl1.ChartAreas(0).Axes("AxisY"), GrapeCity.ActiveReports.Chart.Axis)))
    .StartValue = 33
End With
With wallRange3
    .Backdrop = New GrapeCity.ActiveReports.Chart.Graphics.Backdrop(Color.DarkGreen, CType(150, Byte))
    .Border = New GrapeCity.ActiveReports.Chart.Border(New GrapeCity.ActiveReports.Chart.Graphics.Line(Color.Transparent, 0, GrapeCity.ActiveReports.Chart.Graphics.LineStyle.None), 0, Color.Black)
    .EndValue = 40
    .PrimaryAxis = ((CType(Me.ChartControl1.ChartAreas(0).Axes("AxisZ"), GrapeCity.ActiveReports.Chart.Axis)))
    .StartValue = 20
End With

' Add the WallRange to the chart area and set wall and Z axis properties to show lines.
With ChartControl1.ChartAreas(0)
    .WallRanges.AddRange(New GrapeCity.ActiveReports.Chart.WallRange() {wallRange1, wallRange2, wallRange3})
    .WallXY.Backdrop.Alpha = 100
    .WallXZ.Backdrop.Alpha = 100
    .WallYZ.Backdrop.Alpha = 100
    .Axes(4).MajorTick.Step = 20
    .Axes(4).Max = 60
    .Axes(4).Min = 0
    .Axes(4).Visible = True
End With
|
|
To write code in C#
| C# code. Paste INSIDE the section Format event |
Copy Code
|
|---|---|
// Create the WallRange objects
GrapeCity.ActiveReports.Chart.WallRange wallRange1 = new GrapeCity.ActiveReports.Chart.WallRange();
GrapeCity.ActiveReports.Chart.WallRange wallRange2 = new GrapeCity.ActiveReports.Chart.WallRange();
GrapeCity.ActiveReports.Chart.WallRange wallRange3 = new GrapeCity.ActiveReports.Chart.WallRange();

// Set WallRange property
wallRange1.Backdrop = new GrapeCity.ActiveReports.Chart.Graphics.Backdrop(System.Drawing.Color.White);
wallRange1.Border = new GrapeCity.ActiveReports.Chart.Border(new GrapeCity.ActiveReports.Chart.Graphics.Line
(System.Drawing.Color.Transparent, 0, GrapeCity.ActiveReports.Chart.Graphics.LineStyle.None),
0, System.Drawing.Color.Black);
wallRange1.EndValue = 40;
wallRange1.PrimaryAxis = (GrapeCity.ActiveReports.Chart.Axis)this.ChartControl1.ChartAreas[0].Axes["AxisY"];
wallRange1.StartValue = 30;
wallRange2.Backdrop = new GrapeCity.ActiveReports.Chart.Graphics.Backdrop(System.Drawing.Color.Lime);
wallRange2.Border = new GrapeCity.ActiveReports.Chart.Border(new GrapeCity.ActiveReports.Chart.Graphics.Line
(System.Drawing.Color.Transparent, 0, GrapeCity.ActiveReports.Chart.Graphics.LineStyle.None),
0, System.Drawing.Color.Black);
wallRange2.EndValue = 34;
wallRange2.PrimaryAxis = (GrapeCity.ActiveReports.Chart.Axis)this.ChartControl1.ChartAreas[0].Axes["AxisY"];
wallRange2.StartValue = 33;
wallRange3.Backdrop = new GrapeCity.ActiveReports.Chart.Graphics.Backdrop(System.Drawing.Color.DarkGreen);
wallRange3.Border = new GrapeCity.ActiveReports.Chart.Border(new GrapeCity.ActiveReports.Chart.Graphics.Line
(System.Drawing.Color.Transparent, 0, GrapeCity.ActiveReports.Chart.Graphics.LineStyle.None),
0, System.Drawing.Color.Black);
wallRange3.EndValue = 40;
wallRange3.PrimaryAxis = (GrapeCity.ActiveReports.Chart.Axis)this.ChartControl1.ChartAreas[0].Axes["AxisZ"];
wallRange3.StartValue = 20;

// Add the WallRange to the chart area and set wall and Z axis properties to show lines.
this.ChartControl1.ChartAreas[0].WallRanges.AddRange(
new GrapeCity.ActiveReports.Chart.WallRange[] {wallRange1,wallRange2,wallRange3});
this.ChartControl1.ChartAreas[0].WallXY.Backdrop.Alpha = 100;
this.ChartControl1.ChartAreas[0].WallXZ.Backdrop.Alpha = 100;
this.ChartControl1.ChartAreas[0].WallYZ.Backdrop.Alpha = 100;
this.ChartControl1.ChartAreas[0].Axes[4].MajorTick.Step = 20;
this.ChartControl1.ChartAreas[0].Axes[4].Max = 60;
this.ChartControl1.ChartAreas[0].Axes[4].Min = 0;
this.ChartControl1.ChartAreas[0].Axes[4].Visible = true;
|
|
See Also