Create a Bullet Graph
In This Topic
You can create a bullet graph based on aggregated data from the data source. The following steps demonstrate how to create a bullet graph.
These steps assume that you have already added a Page Report/RDL Report template to your project and connected it to a data source. See Quick Start and Connect to a Data Source for more information.
- From the Visual Studio toolbox, drag a drop Table control onto the design surface.
- From the Visual Studio toolbox, drag a Bullet control onto the detail row of the table and in the properties window, set its Value property to a numeric field (like
=Fields!SalesAmount.Value). This Value property is used to define the key measure displayed on the graph.
- With the Bullet control selected on the design surface:
- Set its Target Value property to 200. This property defines a target for the Value to be compared to.
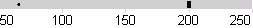
- Set its Best Value property to 500 and the Worst Value property to 0. The Best Value and Worst Value properties define the value range on the graph.
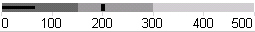
- You can also optionally encode the segments on the graph as qualitative ranges indicating bad, satisfactory and good sections.
- The Range1Boundary property defines a value for the bad/satisfactory boundary on the graph. Set this property to 150.
- The Range2Boundary property defines a value for the satisfactory/good boundary on the graph. Set this property to 300.
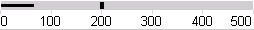
- You can also optionally define the Interval property for the graph value range. So, set this property to 100.
- Set its Target Value property to 200. This property defines a target for the Value to be compared to.
- Go to the Preview tab to view the bullet graph you have added to your report.
As the bullet graph is based on aggregated data, you get a stack of bullet graphs indicating the Sales Amount value for different customers.
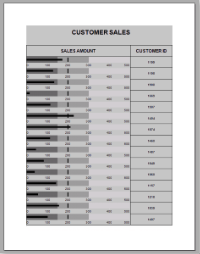
A Bullet graph
See Also